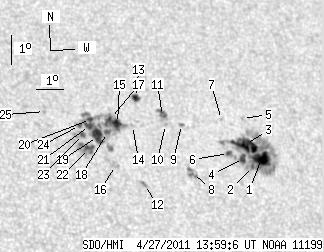
SDO HMI 2011-04-27 13:59:06 UT
See sunspots with tool (Click here to study sunspot positions and configurations with tool using white-light and magnetogram images and polarity drawing)
(It is recommended to set high resolution on your display!)
| group | Proj. U | Proj. WS | Corr. U | Corr. WS | B | L | LCM | Pos. angle | r | MU | MP |
| 83.46 | 271.15 | 52.95 | 172.03 | 20.66 | 188.55 | 29.68 | 312.06 | 0.6252 | -133.9 | 21.6 | |
|
previous
or next observation for the same group /
back to the solar disc SDO HMI 2011-04-27 13:59:06 UT
See sunspots with tool (Click here to study sunspot positions and configurations with tool using white-light and magnetogram images and polarity drawing) (It is recommended to set high resolution on your display!) |
| spot | Proj. U | Proj. WS | Corr. U | Corr. WS | B | L | LCM | Pos. angle | r | MU | MP |
| 15.39 | 129.92 | 10.03 | 84.51 | 20.24 | 191.47 | 32.60 | 308.88 | 0.6515 | -1063.5 | -315.8 | |
| 1.42 | -1.00 | 0.92 | -1.00 | 19.96 | 191.06 | 32.19 | 308.85 | 0.6452 | -920.4 | 999999 | |
| 20.56 | -1.00 | 13.36 | -1.00 | 20.69 | 190.97 | 32.09 | 309.85 | 0.6497 | -833.5 | 999999 | |
| 4.54 | -1.00 | 2.93 | -1.00 | 20.21 | 190.78 | 31.90 | 309.41 | 0.6441 | -1011.4 | 999999 | |
| 0.00 | 1.51 | 0.00 | 0.99 | 21.56 | 191.06 | 32.19 | 310.86 | 0.6574 | -551.0 | -404.5 | |
| 2.22 | -1.00 | 1.43 | -1.00 | 20.36 | 190.24 | 31.37 | 310.04 | 0.6397 | -917.2 | 999999 | |
| 0.00 | 1.16 | 0.00 | 0.75 | 21.49 | 190.24 | 31.37 | 311.47 | 0.6487 | -784.0 | -595.4 | |
| 0.00 | 6.23 | 0.00 | 3.92 | 19.63 | 188.74 | 29.86 | 310.43 | 0.6184 | -942.0 | -576.1 | |
| 0.00 | 2.31 | 0.00 | 1.47 | 21.25 | 188.68 | 29.80 | 312.56 | 0.6312 | -774.0 | -538.7 | |
| 0.00 | 1.16 | 0.00 | 0.73 | 21.23 | 188.08 | 29.20 | 313.09 | 0.6250 | -672.0 | -523.6 | |
| 0.00 | 8.19 | 0.00 | 5.20 | 21.53 | 188.03 | 29.16 | 313.50 | 0.6271 | -906.0 | -586.1 | |
| 0.00 | 2.31 | 0.00 | 1.42 | 19.19 | 186.90 | 28.02 | 311.59 | 0.5954 | 730.0 | 654.7 | |
| 4.09 | 5.43 | 2.59 | 3.43 | 22.10 | 187.20 | 28.32 | 315.00 | 0.6239 | 632.7 | 345.1 | |
| 0.00 | 1.51 | 0.00 | 0.95 | 21.15 | 186.84 | 27.97 | 314.16 | 0.6120 | 600.0 | 429.8 | |
| 5.16 | 85.25 | 3.21 | 52.67 | 21.19 | 186.31 | 27.43 | 314.76 | 0.6071 | 751.6 | 514.1 | |
| 0.00 | 3.92 | 0.00 | 2.40 | 19.78 | 185.96 | 27.08 | 313.30 | 0.5909 | 578.0 | 489.6 | |
| 1.25 | -15.00 | 0.77 | -15.00 | 21.35 | 186.08 | 27.20 | 315.18 | 0.6063 | 690.3 | 999999 | |
| 2.76 | -15.00 | 1.70 | -15.00 | 20.88 | 185.88 | 27.00 | 314.79 | 0.6000 | 748.0 | 999999 | |
| 10.86 | -15.00 | 6.68 | -15.00 | 20.73 | 185.49 | 26.61 | 315.01 | 0.5947 | 986.0 | 999999 | |
| 2.22 | -15.00 | 1.37 | -15.00 | 21.29 | 185.34 | 26.47 | 315.86 | 0.5985 | 580.2 | 999999 | |
| 4.00 | -15.00 | 2.46 | -15.00 | 21.09 | 185.27 | 26.39 | 315.69 | 0.5959 | 865.8 | 999999 | |
| 5.43 | 15.13 | 3.32 | 9.23 | 20.32 | 185.12 | 26.25 | 314.86 | 0.5872 | 930.8 | 740.6 | |
| 2.31 | 6.14 | 1.42 | 3.76 | 20.78 | 184.99 | 26.11 | 315.59 | 0.5903 | 935.9 | 696.1 | |
| 1.25 | -15.00 | 0.76 | -15.00 | 21.07 | 184.90 | 26.03 | 316.05 | 0.5922 | 880.1 | 999999 | |
| 0.00 | 0.98 | 0.00 | 0.60 | 21.50 | 183.73 | 24.85 | 317.86 | 0.5850 | 763.0 | 628.2 | |
| Proj. U | - Projected umbra area in millionths of solar disc, negative values indicate | |
|
that the umbra consists of fragmented regions which cannot be separated without losing umbral area. In this way several spots (intensity minima in the umbra) have a common umbra, e.g. -2 means that the given spot shares an umbra with spot No.2, and the common U value is indicated at spot No.2. |
||
| Proj. WS | - Projected whole spot area in millionths of solar disc, negative values indicate | |
|
that several umbras have a common penumbra, e.g. -7 means that the given umbra shares a penumbra with umbra No.7, and the WS value is indicated at No.7. |
||
| Corr. U | - Corrected umbra area in millionths of solar hemisphere, for negative values see above | |
| Corr. WS | - Corrected whole spot area in millionths of solar hemisphere, for negative values see above | |
| B | - Heliographic latitude B; positive: North, negative: South | |
| L | - Heliographic longitude L | |
| LCM | - Longitudinal distance from the Sun's central meridian | |
| Pos. angle | - Position angle | |
| r | - Distance from the centre of Sun's disc in terms of Sun's radius | |
| MU | - Mean magnetic field within the umbra contour averaged the pixel values with sign. | |
| MP | - Mean magnetic field within the penumbra contour averaged the pixel values with sign. | |