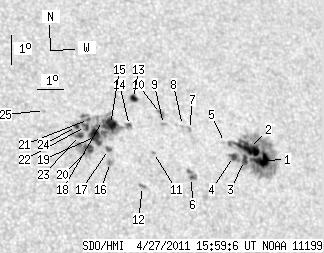
SDO HMI 2011-04-27 15:59:06 UT
See sunspots with tool (Click here to study sunspot positions and configurations with tool using white-light and magnetogram images and polarity drawing)
(It is recommended to set high resolution on your display!)
| group | Proj. U | Proj. WS | Corr. U | Corr. WS | B | L | LCM | Pos. angle | r | MU | MP |
| 88.53 | 284.88 | 56.52 | 182.87 | 20.59 | 188.61 | 30.84 | 310.93 | 0.6364 | 8.3 | -27.3 | |
|
previous
or next observation for the same group /
back to the solar disc SDO HMI 2011-04-27 15:59:06 UT
See sunspots with tool (Click here to study sunspot positions and configurations with tool using white-light and magnetogram images and polarity drawing) (It is recommended to set high resolution on your display!) |
| spot | Proj. U | Proj. WS | Corr. U | Corr. WS | B | L | LCM | Pos. angle | r | MU | MP |
| 13.26 | 138.70 | 8.75 | 91.49 | 20.20 | 191.55 | 33.77 | 307.88 | 0.6633 | -1019.5 | -338.0 | |
| 16.19 | -1.00 | 10.67 | -1.00 | 20.58 | 191.18 | 33.40 | 308.65 | 0.6622 | -927.6 | 999999 | |
| 4.09 | -1.00 | 2.68 | -1.00 | 20.17 | 190.88 | 33.11 | 308.37 | 0.6562 | -1025.4 | 999999 | |
| 3.83 | -1.00 | 2.50 | -1.00 | 20.28 | 190.49 | 32.71 | 308.83 | 0.6530 | -958.3 | 999999 | |
| 0.00 | 1.78 | 0.00 | 1.16 | 20.74 | 190.25 | 32.48 | 309.60 | 0.6540 | -650.0 | -504.1 | |
| 1.42 | 6.94 | 0.91 | 4.42 | 19.51 | 188.72 | 30.95 | 309.31 | 0.6288 | -845.4 | -442.5 | |
| 0.00 | 2.14 | 0.00 | 1.38 | 21.11 | 189.01 | 31.23 | 311.11 | 0.6443 | -586.0 | -475.9 | |
| 0.00 | 1.25 | 0.00 | 0.80 | 21.24 | 188.77 | 31.00 | 311.47 | 0.6430 | -454.0 | -463.8 | |
| 0.00 | 1.51 | 0.00 | 0.97 | 21.24 | 188.06 | 30.28 | 312.11 | 0.6358 | -701.0 | -586.6 | |
| 0.00 | 4.36 | 0.00 | 2.80 | 21.61 | 188.03 | 30.25 | 312.59 | 0.6386 | -642.0 | -679.4 | |
| 0.00 | 1.42 | 0.00 | 0.90 | 20.28 | 187.47 | 29.70 | 311.42 | 0.6220 | 643.0 | 485.3 | |
| 0.00 | 2.76 | 0.00 | 1.71 | 19.14 | 186.84 | 29.06 | 310.51 | 0.6058 | 739.0 | 588.6 | |
| 4.09 | 5.34 | 2.61 | 3.41 | 22.07 | 187.12 | 29.35 | 313.99 | 0.6336 | 621.1 | 390.6 | |
| 2.05 | 3.20 | 1.29 | 2.02 | 21.15 | 186.77 | 29.00 | 313.18 | 0.6222 | 495.9 | 372.7 | |
| 11.66 | 81.94 | 7.31 | 51.11 | 21.16 | 186.07 | 28.30 | 313.86 | 0.6153 | 767.6 | 444.5 | |
| 0.00 | 3.65 | 0.00 | 2.26 | 19.89 | 185.81 | 28.04 | 312.48 | 0.6016 | 900.0 | 620.8 | |
| 2.85 | 3.11 | 1.77 | 1.93 | 20.32 | 185.82 | 28.05 | 313.03 | 0.6055 | 620.8 | 204.3 | |
| 0.53 | -15.00 | 0.33 | -15.00 | 21.28 | 185.80 | 28.03 | 314.27 | 0.6138 | 310.3 | 999999 | |
| 11.92 | -15.00 | 7.40 | -15.00 | 20.73 | 185.43 | 27.66 | 313.95 | 0.6052 | 973.6 | 999999 | |
| 5.69 | 18.15 | 3.51 | 11.18 | 20.32 | 185.13 | 27.36 | 313.72 | 0.5985 | 918.2 | 710.7 | |
| 1.42 | -15.00 | 0.89 | -15.00 | 21.30 | 185.29 | 27.52 | 314.80 | 0.6088 | 510.7 | 999999 | |
| 3.83 | -15.00 | 2.38 | -15.00 | 21.06 | 185.13 | 27.36 | 314.65 | 0.6051 | 827.0 | 999999 | |
| 3.56 | 7.56 | 2.20 | 4.67 | 20.74 | 184.85 | 27.08 | 314.54 | 0.5995 | 945.7 | 613.9 | |
| 2.14 | -15.00 | 1.32 | -15.00 | 21.04 | 184.80 | 27.03 | 314.97 | 0.6017 | 757.5 | 999999 | |
| 0.00 | 1.07 | 0.00 | 0.66 | 21.54 | 183.74 | 25.97 | 316.70 | 0.5960 | 719.0 | 578.8 | |
| Proj. U | - Projected umbra area in millionths of solar disc, negative values indicate | |
|
that the umbra consists of fragmented regions which cannot be separated without losing umbral area. In this way several spots (intensity minima in the umbra) have a common umbra, e.g. -2 means that the given spot shares an umbra with spot No.2, and the common U value is indicated at spot No.2. |
||
| Proj. WS | - Projected whole spot area in millionths of solar disc, negative values indicate | |
|
that several umbras have a common penumbra, e.g. -7 means that the given umbra shares a penumbra with umbra No.7, and the WS value is indicated at No.7. |
||
| Corr. U | - Corrected umbra area in millionths of solar hemisphere, for negative values see above | |
| Corr. WS | - Corrected whole spot area in millionths of solar hemisphere, for negative values see above | |
| B | - Heliographic latitude B; positive: North, negative: South | |
| L | - Heliographic longitude L | |
| LCM | - Longitudinal distance from the Sun's central meridian | |
| Pos. angle | - Position angle | |
| r | - Distance from the centre of Sun's disc in terms of Sun's radius | |
| MU | - Mean magnetic field within the umbra contour averaged the pixel values with sign. | |
| MP | - Mean magnetic field within the penumbra contour averaged the pixel values with sign. | |