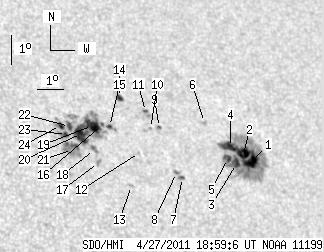
SDO HMI 2011-04-27 18:59:06 UT
See sunspots with tool (Click here to study sunspot positions and configurations with tool using white-light and magnetogram images and polarity drawing)
(It is recommended to set high resolution on your display!)
| group | Proj. U | Proj. WS | Corr. U | Corr. WS | B | L | LCM | Pos. angle | r | MU | MP |
| 83.27 | 286.05 | 54.16 | 187.30 | 20.50 | 188.78 | 32.67 | 309.28 | 0.6544 | 3.8 | -42.5 | |
|
previous
or next observation for the same group /
back to the solar disc SDO HMI 2011-04-27 18:59:06 UT
See sunspots with tool (Click here to study sunspot positions and configurations with tool using white-light and magnetogram images and polarity drawing) (It is recommended to set high resolution on your display!) |
| spot | Proj. U | Proj. WS | Corr. U | Corr. WS | B | L | LCM | Pos. angle | r | MU | MP |
| 11.12 | 149.47 | 7.51 | 100.69 | 20.15 | 191.72 | 35.60 | 306.46 | 0.6818 | -971.9 | -357.9 | |
| 8.45 | -1.00 | 5.70 | -1.00 | 20.40 | 191.47 | 35.35 | 306.95 | 0.6810 | -980.4 | 999999 | |
| 5.43 | -1.00 | 3.63 | -1.00 | 20.05 | 191.10 | 34.99 | 306.78 | 0.6748 | -1087.2 | 999999 | |
| 5.43 | -1.00 | 3.65 | -1.00 | 20.58 | 191.00 | 34.89 | 307.52 | 0.6774 | -832.4 | 999999 | |
| 4.36 | -1.00 | 2.91 | -1.00 | 20.20 | 190.79 | 34.67 | 307.21 | 0.6726 | -1003.0 | 999999 | |
| 0.00 | 1.96 | 0.00 | 1.31 | 21.37 | 190.19 | 34.08 | 309.12 | 0.6748 | -626.0 | -502.5 | |
| 1.51 | 2.31 | 0.98 | 1.50 | 19.49 | 188.88 | 32.76 | 307.77 | 0.6476 | -794.5 | -740.1 | |
| 0.00 | 2.76 | 0.00 | 1.79 | 19.65 | 188.68 | 32.57 | 308.13 | 0.6467 | -106.0 | -157.6 | |
| 0.44 | 1.69 | 0.29 | 1.10 | 21.12 | 188.38 | 32.27 | 310.25 | 0.6548 | -659.4 | -514.9 | |
| 0.00 | 1.16 | 0.00 | 0.75 | 21.07 | 188.03 | 31.91 | 310.49 | 0.6508 | -711.0 | -629.2 | |
| 0.62 | 4.36 | 0.41 | 2.85 | 21.64 | 187.98 | 31.86 | 311.24 | 0.6547 | -759.0 | -492.0 | |
| 0.00 | 0.53 | 0.00 | 0.34 | 20.25 | 187.42 | 31.30 | 309.96 | 0.6382 | 551.0 | 488.7 | |
| 0.00 | 2.05 | 0.00 | 1.29 | 19.14 | 186.88 | 30.76 | 308.98 | 0.6239 | 712.0 | 562.3 | |
| 2.67 | 3.56 | 1.73 | 2.31 | 22.07 | 187.09 | 30.97 | 312.53 | 0.6494 | 553.4 | 409.6 | |
| 2.05 | 4.00 | 1.31 | 2.56 | 21.07 | 186.48 | 30.36 | 311.83 | 0.6352 | 487.4 | 363.7 | |
| 0.98 | 84.97 | 0.62 | 53.74 | 21.13 | 186.23 | 30.11 | 312.12 | 0.6332 | 334.1 | 435.4 | |
| 0.00 | 2.94 | 0.00 | 1.85 | 19.85 | 185.80 | 29.68 | 310.87 | 0.6183 | 836.0 | 639.3 | |
| 0.00 | 4.45 | 0.00 | 2.81 | 20.28 | 185.74 | 29.63 | 311.48 | 0.6212 | 740.0 | 534.7 | |
| 13.43 | -16.00 | 8.54 | -16.00 | 21.08 | 185.84 | 29.73 | 312.41 | 0.6289 | 769.9 | 999999 | |
| 17.88 | -16.00 | 11.28 | -16.00 | 20.79 | 185.37 | 29.25 | 312.49 | 0.6218 | 918.4 | 999999 | |
| 0.00 | 19.84 | 0.00 | 12.41 | 20.25 | 184.92 | 28.81 | 312.20 | 0.6125 | 990.0 | 732.6 | |
| 3.65 | -16.00 | 2.30 | -16.00 | 21.01 | 184.97 | 28.86 | 313.13 | 0.6196 | 781.0 | 999999 | |
| 1.96 | -16.00 | 1.23 | -16.00 | 20.74 | 184.80 | 28.69 | 312.95 | 0.6156 | 989.4 | 999999 | |
| 3.29 | -16.00 | 2.07 | -16.00 | 21.03 | 184.64 | 28.53 | 313.47 | 0.6165 | 773.1 | 999999 | |
| Proj. U | - Projected umbra area in millionths of solar disc, negative values indicate | |
|
that the umbra consists of fragmented regions which cannot be separated without losing umbral area. In this way several spots (intensity minima in the umbra) have a common umbra, e.g. -2 means that the given spot shares an umbra with spot No.2, and the common U value is indicated at spot No.2. |
||
| Proj. WS | - Projected whole spot area in millionths of solar disc, negative values indicate | |
|
that several umbras have a common penumbra, e.g. -7 means that the given umbra shares a penumbra with umbra No.7, and the WS value is indicated at No.7. |
||
| Corr. U | - Corrected umbra area in millionths of solar hemisphere, for negative values see above | |
| Corr. WS | - Corrected whole spot area in millionths of solar hemisphere, for negative values see above | |
| B | - Heliographic latitude B; positive: North, negative: South | |
| L | - Heliographic longitude L | |
| LCM | - Longitudinal distance from the Sun's central meridian | |
| Pos. angle | - Position angle | |
| r | - Distance from the centre of Sun's disc in terms of Sun's radius | |
| MU | - Mean magnetic field within the umbra contour averaged the pixel values with sign. | |
| MP | - Mean magnetic field within the penumbra contour averaged the pixel values with sign. | |