SDO HMI 2011-04-27 19:59:06 UT
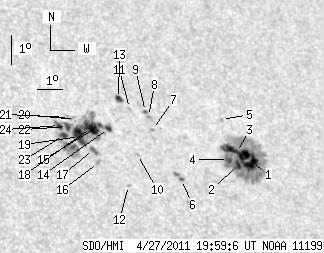
See sunspots with tool (Click here to study sunspot positions and configurations with tool using white-light and magnetogram images and polarity drawing)
(It is recommended to set high resolution on your display!)
| group | Proj. U | Proj. WS | Corr. U | Corr. WS | B | L | LCM | Pos. angle | r | MU | MP |
| 86.84 | 280.73 | 56.86 | 184.92 | 20.58 | 188.72 | 33.16 | 308.99 | 0.6600 | -17.5 | 0.2 | |
|
previous
or next observation for the same group /
back to the solar disc SDO HMI 2011-04-27 19:59:06 UT
See sunspots with tool (Click here to study sunspot positions and configurations with tool using white-light and magnetogram images and polarity drawing) (It is recommended to set high resolution on your display!) |
| spot | Proj. U | Proj. WS | Corr. U | Corr. WS | B | L | LCM | Pos. angle | r | MU | MP |
| 12.72 | 142.81 | 8.66 | 97.02 | 20.15 | 191.77 | 36.21 | 306.03 | 0.6880 | -883.3 | -333.5 | |
| 3.29 | -1.00 | 2.22 | -1.00 | 20.06 | 191.23 | 35.67 | 306.29 | 0.6818 | -1119.2 | 999999 | |
| 17.35 | -1.00 | 11.76 | -1.00 | 20.46 | 191.25 | 35.69 | 306.77 | 0.6848 | -900.7 | 999999 | |
| 3.56 | -1.00 | 2.39 | -1.00 | 20.21 | 190.87 | 35.31 | 306.74 | 0.6792 | -1020.7 | 999999 | |
| 0.00 | 1.25 | 0.00 | 0.85 | 21.54 | 190.96 | 35.39 | 308.33 | 0.6891 | -548.0 | -448.9 | |
| 1.42 | 3.74 | 0.93 | 2.44 | 19.45 | 188.86 | 33.29 | 307.30 | 0.6529 | -818.7 | -239.5 | |
| 0.00 | 1.25 | 0.00 | 0.82 | 21.07 | 188.13 | 32.57 | 309.94 | 0.6575 | -676.0 | -551.9 | |
| 0.00 | 1.42 | 0.00 | 0.94 | 21.51 | 188.09 | 32.52 | 310.52 | 0.6603 | -544.0 | -376.2 | |
| 1.16 | 1.60 | 0.76 | 1.05 | 21.67 | 188.01 | 32.45 | 310.78 | 0.6608 | -603.6 | -613.4 | |
| 0.00 | 0.71 | 0.00 | 0.46 | 20.21 | 187.35 | 31.79 | 309.49 | 0.6429 | 553.0 | 500.4 | |
| 0.00 | 1.78 | 0.00 | 1.16 | 21.74 | 187.42 | 31.85 | 311.37 | 0.6555 | -589.0 | -534.5 | |
| 0.00 | 1.16 | 0.00 | 0.74 | 19.16 | 186.78 | 31.22 | 308.62 | 0.6289 | 634.0 | 559.1 | |
| 3.65 | 4.27 | 2.38 | 2.79 | 22.06 | 187.08 | 31.51 | 312.05 | 0.6547 | 380.9 | 229.4 | |
| 3.20 | 108.91 | 2.06 | 69.14 | 21.03 | 186.45 | 30.88 | 311.31 | 0.6402 | 562.9 | 533.9 | |
| 1.96 | -14.00 | 1.26 | -14.00 | 21.12 | 186.13 | 30.57 | 311.70 | 0.6376 | 381.2 | 999999 | |
| 0.00 | 2.49 | 0.00 | 1.58 | 19.88 | 185.82 | 30.25 | 310.40 | 0.6244 | 820.0 | 674.3 | |
| 2.94 | 4.27 | 1.86 | 2.71 | 20.30 | 185.72 | 30.16 | 311.03 | 0.6269 | 541.7 | 533.0 | |
| 12.01 | -14.00 | 7.67 | -14.00 | 21.04 | 185.81 | 30.25 | 311.89 | 0.6338 | 782.1 | 999999 | |
| 12.72 | -14.00 | 8.06 | -14.00 | 20.72 | 185.29 | 29.73 | 311.95 | 0.6259 | 931.9 | 999999 | |
| 0.00 | 1.51 | 0.00 | 0.96 | 21.28 | 185.27 | 29.70 | 312.69 | 0.6304 | 317.0 | 263.4 | |
| 0.00 | 3.56 | 0.00 | 2.26 | 21.34 | 185.05 | 29.49 | 312.95 | 0.6288 | 452.0 | 353.8 | |
| 4.45 | -14.00 | 2.82 | -14.00 | 21.04 | 184.91 | 29.35 | 312.70 | 0.6248 | 727.7 | 999999 | |
| 3.74 | -14.00 | 2.35 | -14.00 | 20.73 | 184.70 | 29.14 | 312.51 | 0.6200 | 997.5 | 999999 | |
| 2.67 | -14.00 | 1.68 | -14.00 | 21.06 | 184.62 | 29.06 | 313.00 | 0.6220 | 804.6 | 999999 | |
| Proj. U | - Projected umbra area in millionths of solar disc, negative values indicate | |
|
that the umbra consists of fragmented regions which cannot be separated without losing umbral area. In this way several spots (intensity minima in the umbra) have a common umbra, e.g. -2 means that the given spot shares an umbra with spot No.2, and the common U value is indicated at spot No.2. |
||
| Proj. WS | - Projected whole spot area in millionths of solar disc, negative values indicate | |
|
that several umbras have a common penumbra, e.g. -7 means that the given umbra shares a penumbra with umbra No.7, and the WS value is indicated at No.7. |
||
| Corr. U | - Corrected umbra area in millionths of solar hemisphere, for negative values see above | |
| Corr. WS | - Corrected whole spot area in millionths of solar hemisphere, for negative values see above | |
| B | - Heliographic latitude B; positive: North, negative: South | |
| L | - Heliographic longitude L | |
| LCM | - Longitudinal distance from the Sun's central meridian | |
| Pos. angle | - Position angle | |
| r | - Distance from the centre of Sun's disc in terms of Sun's radius | |
| MU | - Mean magnetic field within the umbra contour averaged the pixel values with sign. | |
| MP | - Mean magnetic field within the penumbra contour averaged the pixel values with sign. | |