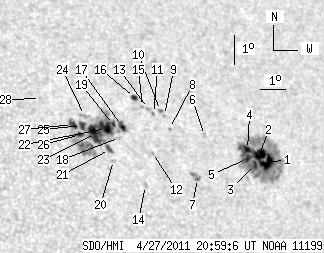
SDO HMI 2011-04-27 20:59:06 UT
See sunspots with tool (Click here to study sunspot positions and configurations with tool using white-light and magnetogram images and polarity drawing)
(It is recommended to set high resolution on your display!)
| group | Proj. U | Proj. WS | Corr. U | Corr. WS | B | L | LCM | Pos. angle | r | MU | MP |
| 84.79 | 296.33 | 55.69 | 196.36 | 20.55 | 188.76 | 33.75 | 308.48 | 0.6658 | 43.3 | -40.3 | |
|
previous
or next observation for the same group /
back to the solar disc SDO HMI 2011-04-27 20:59:06 UT
See sunspots with tool (Click here to study sunspot positions and configurations with tool using white-light and magnetogram images and polarity drawing) (It is recommended to set high resolution on your display!) |
| spot | Proj. U | Proj. WS | Corr. U | Corr. WS | B | L | LCM | Pos. angle | r | MU | MP |
| 11.83 | 147.27 | 8.11 | 100.81 | 20.12 | 191.81 | 36.80 | 305.57 | 0.6938 | -880.0 | -350.0 | |
| 10.41 | -1.00 | 7.13 | -1.00 | 20.37 | 191.55 | 36.55 | 306.06 | 0.6929 | -906.3 | 999999 | |
| 2.58 | -1.00 | 1.76 | -1.00 | 20.02 | 191.30 | 36.29 | 305.81 | 0.6880 | -1150.2 | 999999 | |
| 3.38 | -1.00 | 2.31 | -1.00 | 20.51 | 191.11 | 36.10 | 306.55 | 0.6893 | -912.4 | 999999 | |
| 2.76 | -1.00 | 1.87 | -1.00 | 20.21 | 191.03 | 36.02 | 306.23 | 0.6865 | -1061.5 | 999999 | |
| 0.00 | 1.96 | 0.00 | 1.31 | 20.90 | 189.51 | 34.51 | 308.20 | 0.6757 | -552.0 | -449.8 | |
| 0.53 | 5.61 | 0.35 | 3.68 | 19.45 | 188.88 | 33.87 | 306.85 | 0.6589 | -886.3 | -448.5 | |
| 0.00 | 1.16 | 0.00 | 0.76 | 21.07 | 188.19 | 33.19 | 309.44 | 0.6636 | -573.0 | -528.6 | |
| 0.00 | 0.89 | 0.00 | 0.59 | 21.50 | 188.11 | 33.10 | 310.04 | 0.6660 | -558.0 | -435.5 | |
| 1.51 | 1.87 | 1.00 | 1.24 | 21.66 | 188.00 | 32.99 | 310.33 | 0.6661 | -571.5 | -588.0 | |
| 0.00 | 1.78 | 0.00 | 1.17 | 21.55 | 187.70 | 32.69 | 310.43 | 0.6622 | -719.0 | -572.8 | |
| 0.00 | 1.33 | 0.00 | 0.87 | 20.24 | 187.34 | 32.33 | 309.08 | 0.6486 | 565.0 | 410.0 | |
| 0.00 | 1.69 | 0.00 | 1.11 | 21.71 | 187.55 | 32.54 | 310.76 | 0.6620 | -753.0 | -598.4 | |
| 0.00 | 2.85 | 0.00 | 1.82 | 19.12 | 186.82 | 31.81 | 308.07 | 0.6349 | 454.0 | 383.2 | |
| 0.00 | 1.51 | 0.00 | 0.99 | 21.77 | 187.33 | 32.32 | 311.01 | 0.6602 | -634.0 | -487.8 | |
| 2.58 | 3.65 | 1.70 | 2.40 | 22.06 | 187.09 | 32.09 | 311.56 | 0.6602 | 430.4 | 296.4 | |
| 4.54 | 112.12 | 2.94 | 71.53 | 21.06 | 186.39 | 31.38 | 310.91 | 0.6453 | 478.1 | 544.8 | |
| 0.00 | 1.42 | 0.00 | 0.92 | 20.68 | 186.19 | 31.18 | 310.61 | 0.6403 | 575.0 | 440.4 | |
| 2.76 | -17.00 | 1.78 | -17.00 | 21.11 | 186.06 | 31.05 | 311.26 | 0.6424 | 418.4 | 999999 | |
| 0.00 | 1.96 | 0.00 | 1.25 | 19.90 | 185.79 | 30.78 | 309.96 | 0.6300 | 807.0 | 665.7 | |
| 3.38 | 3.92 | 2.16 | 2.50 | 20.26 | 185.72 | 30.71 | 310.49 | 0.6322 | 592.0 | 475.2 | |
| 11.12 | -17.00 | 7.14 | -17.00 | 20.96 | 185.76 | 30.75 | 311.34 | 0.6383 | 805.4 | 999999 | |
| 16.28 | -17.00 | 10.38 | -17.00 | 20.78 | 185.31 | 30.30 | 311.51 | 0.6322 | 894.6 | 999999 | |
| 0.00 | 4.09 | 0.00 | 2.62 | 21.37 | 185.03 | 30.02 | 312.50 | 0.6342 | 423.0 | 335.3 | |
| 3.92 | -17.00 | 2.49 | -17.00 | 21.03 | 184.84 | 29.83 | 312.24 | 0.6295 | 728.8 | 999999 | |
| 2.67 | -17.00 | 1.69 | -17.00 | 20.72 | 184.74 | 29.73 | 311.95 | 0.6259 | 971.9 | 999999 | |
| 4.54 | -17.00 | 2.88 | -17.00 | 21.04 | 184.51 | 29.50 | 312.57 | 0.6263 | 772.9 | 999999 | |
| 0.00 | 1.25 | 0.00 | 0.79 | 21.87 | 183.50 | 28.49 | 314.55 | 0.6235 | 543.0 | 460.9 | |
| Proj. U | - Projected umbra area in millionths of solar disc, negative values indicate | |
|
that the umbra consists of fragmented regions which cannot be separated without losing umbral area. In this way several spots (intensity minima in the umbra) have a common umbra, e.g. -2 means that the given spot shares an umbra with spot No.2, and the common U value is indicated at spot No.2. |
||
| Proj. WS | - Projected whole spot area in millionths of solar disc, negative values indicate | |
|
that several umbras have a common penumbra, e.g. -7 means that the given umbra shares a penumbra with umbra No.7, and the WS value is indicated at No.7. |
||
| Corr. U | - Corrected umbra area in millionths of solar hemisphere, for negative values see above | |
| Corr. WS | - Corrected whole spot area in millionths of solar hemisphere, for negative values see above | |
| B | - Heliographic latitude B; positive: North, negative: South | |
| L | - Heliographic longitude L | |
| LCM | - Longitudinal distance from the Sun's central meridian | |
| Pos. angle | - Position angle | |
| r | - Distance from the centre of Sun's disc in terms of Sun's radius | |
| MU | - Mean magnetic field within the umbra contour averaged the pixel values with sign. | |
| MP | - Mean magnetic field within the penumbra contour averaged the pixel values with sign. | |