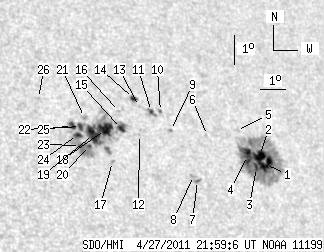
SDO HMI 2011-04-27 21:59:06 UT
See sunspots with tool (Click here to study sunspot positions and configurations with tool using white-light and magnetogram images and polarity drawing)
(It is recommended to set high resolution on your display!)
| group | Proj. U | Proj. WS | Corr. U | Corr. WS | B | L | LCM | Pos. angle | r | MU | MP |
| 80.01 | 311.67 | 52.86 | 208.01 | 20.55 | 188.72 | 34.26 | 308.08 | 0.6709 | 58.1 | -36.8 | |
|
previous
or next observation for the same group /
back to the solar disc SDO HMI 2011-04-27 21:59:06 UT
See sunspots with tool (Click here to study sunspot positions and configurations with tool using white-light and magnetogram images and polarity drawing) (It is recommended to set high resolution on your display!) |
| spot | Proj. U | Proj. WS | Corr. U | Corr. WS | B | L | LCM | Pos. angle | r | MU | MP |
| 10.32 | 155.92 | 7.13 | 107.54 | 20.08 | 191.77 | 37.31 | 305.17 | 0.6988 | -855.9 | -333.5 | |
| 7.83 | -1.00 | 5.41 | -1.00 | 20.37 | 191.61 | 37.15 | 305.64 | 0.6990 | -880.2 | 999999 | |
| 2.85 | -1.00 | 1.95 | -1.00 | 19.96 | 191.37 | 36.92 | 305.29 | 0.6940 | -1097.0 | 999999 | |
| 7.92 | -1.00 | 5.43 | -1.00 | 20.34 | 191.12 | 36.66 | 305.95 | 0.6939 | -990.1 | 999999 | |
| 0.00 | 2.22 | 0.00 | 1.53 | 21.16 | 190.91 | 36.45 | 307.11 | 0.6971 | -500.0 | -415.4 | |
| 0.00 | 0.36 | 0.00 | 0.24 | 20.94 | 189.68 | 35.23 | 307.71 | 0.6833 | -623.0 | -625.5 | |
| 1.07 | 2.76 | 0.71 | 1.82 | 19.41 | 188.90 | 34.44 | 306.36 | 0.6647 | -757.8 | -576.5 | |
| 0.00 | 2.14 | 0.00 | 1.41 | 19.57 | 188.78 | 34.33 | 306.66 | 0.6646 | -287.0 | -166.2 | |
| 0.00 | 1.16 | 0.00 | 0.77 | 21.04 | 188.25 | 33.80 | 308.91 | 0.6696 | -682.0 | -596.9 | |
| 1.16 | 1.87 | 0.77 | 1.25 | 21.66 | 188.03 | 33.57 | 309.86 | 0.6718 | -532.4 | -464.4 | |
| 1.60 | 4.63 | 1.06 | 3.07 | 21.65 | 187.67 | 33.22 | 310.12 | 0.6682 | -705.8 | -624.7 | |
| 0.00 | 0.89 | 0.00 | 0.58 | 20.85 | 187.01 | 32.55 | 309.67 | 0.6555 | 291.0 | 217.1 | |
| 0.00 | 0.80 | 0.00 | 0.53 | 21.79 | 187.25 | 32.79 | 310.65 | 0.6651 | -548.0 | -452.1 | |
| 2.76 | 3.65 | 1.83 | 2.42 | 22.05 | 187.08 | 32.63 | 311.10 | 0.6655 | 342.1 | 151.4 | |
| 3.65 | 129.13 | 2.37 | 82.90 | 21.02 | 186.36 | 31.91 | 310.42 | 0.6503 | 519.7 | 467.8 | |
| 0.00 | 0.89 | 0.00 | 0.58 | 21.59 | 186.42 | 31.97 | 311.08 | 0.6554 | 360.0 | 231.8 | |
| 0.00 | 1.87 | 0.00 | 1.20 | 19.90 | 185.76 | 31.31 | 309.50 | 0.6354 | 764.0 | 636.7 | |
| 14.24 | -15.00 | 9.19 | -15.00 | 20.96 | 185.74 | 31.28 | 310.87 | 0.6435 | 763.7 | 999999 | |
| 13.79 | -15.00 | 8.84 | -15.00 | 20.77 | 185.24 | 30.79 | 311.06 | 0.6370 | 896.6 | 999999 | |
| 1.16 | -15.00 | 0.74 | -15.00 | 20.39 | 185.01 | 30.55 | 310.79 | 0.6316 | 871.2 | 999999 | |
| 0.00 | 2.76 | 0.00 | 1.77 | 21.33 | 185.03 | 30.58 | 311.95 | 0.6394 | 561.0 | 360.7 | |
| 3.38 | -15.00 | 2.16 | -15.00 | 21.02 | 184.81 | 30.35 | 311.76 | 0.6346 | 761.1 | 999999 | |
| 1.78 | -15.00 | 1.13 | -15.00 | 20.38 | 184.67 | 30.21 | 311.08 | 0.6280 | 1011.5 | 999999 | |
| 3.03 | -15.00 | 1.93 | -15.00 | 20.74 | 184.64 | 30.18 | 311.57 | 0.6306 | 918.4 | 999999 | |
| 3.47 | -15.00 | 2.21 | -15.00 | 21.04 | 184.51 | 30.06 | 312.05 | 0.6318 | 828.0 | 999999 | |
| 0.00 | 0.62 | 0.00 | 0.40 | 21.90 | 183.44 | 28.98 | 314.12 | 0.6285 | 555.0 | 491.6 | |
| Proj. U | - Projected umbra area in millionths of solar disc, negative values indicate | |
|
that the umbra consists of fragmented regions which cannot be separated without losing umbral area. In this way several spots (intensity minima in the umbra) have a common umbra, e.g. -2 means that the given spot shares an umbra with spot No.2, and the common U value is indicated at spot No.2. |
||
| Proj. WS | - Projected whole spot area in millionths of solar disc, negative values indicate | |
|
that several umbras have a common penumbra, e.g. -7 means that the given umbra shares a penumbra with umbra No.7, and the WS value is indicated at No.7. |
||
| Corr. U | - Corrected umbra area in millionths of solar hemisphere, for negative values see above | |
| Corr. WS | - Corrected whole spot area in millionths of solar hemisphere, for negative values see above | |
| B | - Heliographic latitude B; positive: North, negative: South | |
| L | - Heliographic longitude L | |
| LCM | - Longitudinal distance from the Sun's central meridian | |
| Pos. angle | - Position angle | |
| r | - Distance from the centre of Sun's disc in terms of Sun's radius | |
| MU | - Mean magnetic field within the umbra contour averaged the pixel values with sign. | |
| MP | - Mean magnetic field within the penumbra contour averaged the pixel values with sign. | |