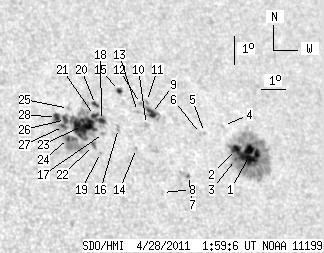
SDO HMI 2011-04-28 01:59:06 UT
See sunspots with tool (Click here to study sunspot positions and configurations with tool using white-light and magnetogram images and polarity drawing)
(It is recommended to set high resolution on your display!)
| group | Proj. U | Proj. WS | Corr. U | Corr. WS | B | L | LCM | Pos. angle | r | MU | MP |
| 91.12 | 303.52 | 61.76 | 208.20 | 20.55 | 188.67 | 36.42 | 306.49 | 0.6926 | 40.6 | -38.3 | |
|
previous
or next observation for the same group /
back to the solar disc SDO HMI 2011-04-28 01:59:06 UT
See sunspots with tool (Click here to study sunspot positions and configurations with tool using white-light and magnetogram images and polarity drawing) (It is recommended to set high resolution on your display!) |
| spot | Proj. U | Proj. WS | Corr. U | Corr. WS | B | L | LCM | Pos. angle | r | MU | MP |
| 23.24 | 141.13 | 16.58 | 100.70 | 20.15 | 191.78 | 39.53 | 303.83 | 0.7216 | -884.1 | -304.2 | |
| 5.70 | -1.00 | 4.04 | -1.00 | 20.33 | 191.25 | 39.00 | 304.37 | 0.7172 | -905.6 | 999999 | |
| 0.89 | -1.00 | 0.63 | -1.00 | 19.99 | 191.15 | 38.90 | 304.02 | 0.7143 | -960.9 | 999999 | |
| 0.00 | 0.53 | 0.00 | 0.38 | 21.11 | 190.99 | 38.74 | 305.49 | 0.7193 | -502.0 | -458.3 | |
| 0.00 | 1.16 | 0.00 | 0.81 | 20.83 | 190.12 | 37.87 | 305.71 | 0.7090 | -636.0 | -597.5 | |
| 0.00 | 1.42 | 0.00 | 0.99 | 20.79 | 189.94 | 37.70 | 305.78 | 0.7070 | -686.0 | -541.2 | |
| 1.25 | 4.36 | 0.85 | 2.97 | 19.36 | 189.06 | 36.81 | 304.59 | 0.6890 | -709.6 | -361.5 | |
| 0.00 | 1.42 | 0.00 | 0.95 | 18.74 | 187.87 | 35.62 | 304.62 | 0.6725 | -623.0 | -528.6 | |
| 5.52 | 11.75 | 3.78 | 8.05 | 21.36 | 188.13 | 35.88 | 307.74 | 0.6925 | -744.0 | -593.8 | |
| 0.00 | 2.49 | 0.00 | 1.69 | 20.98 | 187.82 | 35.57 | 307.50 | 0.6869 | -422.0 | -516.0 | |
| 0.00 | 1.51 | 0.00 | 1.04 | 21.76 | 188.04 | 35.79 | 308.29 | 0.6944 | -502.0 | -398.5 | |
| 0.00 | 1.16 | 0.00 | 0.79 | 21.68 | 187.78 | 35.53 | 308.39 | 0.6912 | -553.0 | -488.8 | |
| 0.00 | 1.87 | 0.00 | 1.27 | 21.40 | 187.58 | 35.33 | 308.19 | 0.6873 | -234.0 | -191.6 | |
| 0.00 | 0.98 | 0.00 | 0.66 | 20.16 | 187.20 | 34.96 | 306.91 | 0.6750 | 508.0 | 399.9 | |
| 2.14 | 3.65 | 1.45 | 2.48 | 22.08 | 187.05 | 34.80 | 309.41 | 0.6869 | 332.4 | 116.8 | |
| 0.00 | 2.49 | 0.00 | 1.67 | 20.79 | 186.66 | 34.41 | 308.12 | 0.6739 | 434.0 | 285.6 | |
| 0.00 | 1.96 | 0.00 | 1.30 | 20.60 | 186.03 | 33.78 | 308.36 | 0.6660 | 604.0 | 472.7 | |
| 3.03 | 116.56 | 2.01 | 76.45 | 21.03 | 186.06 | 33.81 | 308.88 | 0.6695 | 528.7 | 503.0 | |
| 0.00 | 1.25 | 0.00 | 0.82 | 19.96 | 185.75 | 33.50 | 307.76 | 0.6586 | 662.0 | 562.3 | |
| 2.94 | 3.29 | 1.96 | 2.20 | 21.56 | 185.96 | 33.72 | 309.61 | 0.6724 | 361.2 | 196.0 | |
| 2.32 | -18.00 | 1.54 | -18.00 | 21.19 | 185.83 | 33.58 | 309.25 | 0.6683 | 435.4 | 999999 | |
| 2.23 | 2.85 | 1.46 | 1.87 | 20.18 | 185.53 | 33.29 | 308.21 | 0.6579 | 635.5 | 619.0 | |
| 31.25 | -18.00 | 20.55 | -18.00 | 20.83 | 185.27 | 33.02 | 309.25 | 0.6600 | 843.6 | 999999 | |
| 1.16 | -18.00 | 0.75 | -18.00 | 20.37 | 184.62 | 32.37 | 309.19 | 0.6499 | 1054.1 | 999999 | |
| 0.00 | 1.69 | 0.00 | 1.11 | 21.38 | 184.87 | 32.62 | 310.26 | 0.6601 | 425.0 | 353.7 | |
| 3.21 | -18.00 | 2.10 | -18.00 | 21.00 | 184.66 | 32.41 | 309.96 | 0.6551 | 783.3 | 999999 | |
| 2.05 | -18.00 | 1.33 | -18.00 | 20.76 | 184.52 | 32.28 | 309.77 | 0.6519 | 904.8 | 999999 | |
| 4.19 | -18.00 | 2.73 | -18.00 | 21.05 | 184.33 | 32.08 | 310.30 | 0.6521 | 759.7 | 999999 | |
| Proj. U | - Projected umbra area in millionths of solar disc, negative values indicate | |
|
that the umbra consists of fragmented regions which cannot be separated without losing umbral area. In this way several spots (intensity minima in the umbra) have a common umbra, e.g. -2 means that the given spot shares an umbra with spot No.2, and the common U value is indicated at spot No.2. |
||
| Proj. WS | - Projected whole spot area in millionths of solar disc, negative values indicate | |
|
that several umbras have a common penumbra, e.g. -7 means that the given umbra shares a penumbra with umbra No.7, and the WS value is indicated at No.7. |
||
| Corr. U | - Corrected umbra area in millionths of solar hemisphere, for negative values see above | |
| Corr. WS | - Corrected whole spot area in millionths of solar hemisphere, for negative values see above | |
| B | - Heliographic latitude B; positive: North, negative: South | |
| L | - Heliographic longitude L | |
| LCM | - Longitudinal distance from the Sun's central meridian | |
| Pos. angle | - Position angle | |
| r | - Distance from the centre of Sun's disc in terms of Sun's radius | |
| MU | - Mean magnetic field within the umbra contour averaged the pixel values with sign. | |
| MP | - Mean magnetic field within the penumbra contour averaged the pixel values with sign. | |