SDO HMI 2011-06-05 21:59:10 UT
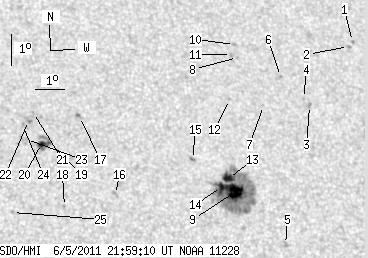
See sunspots with tool (Click here to study sunspot positions and configurations with tool using white-light and magnetogram images and polarity drawing)
(It is recommended to set high resolution on your display!)
| group | Proj. U | Proj. WS | Corr. U | Corr. WS | B | L | LCM | Pos. angle | r | MU | MP |
| 29.57 | 186.67 | 16.51 | 104.58 | 17.42 | 20.45 | 21.81 | 310.54 | 0.4680 | -442.6 | -348.2 | |
|
previous
or next observation for the same group /
back to the solar disc SDO HMI 2011-06-05 21:59:10 UT
See sunspots with tool (Click here to study sunspot positions and configurations with tool using white-light and magnetogram images and polarity drawing) (It is recommended to set high resolution on your display!) |
| spot | Proj. U | Proj. WS | Corr. U | Corr. WS | B | L | LCM | Pos. angle | r | MU | MP |
| 0.00 | 1.27 | 0.00 | 0.76 | 21.72 | 26.18 | 27.54 | 310.91 | 0.5704 | -563.0 | -506.4 | |
| 0.00 | 1.63 | 0.00 | 0.98 | 21.56 | 26.00 | 27.35 | 310.84 | 0.5670 | -885.0 | -703.1 | |
| 0.00 | 2.08 | 0.00 | 1.21 | 19.63 | 24.22 | 25.57 | 309.74 | 0.5308 | -773.0 | -625.9 | |
| 0.00 | 1.27 | 0.00 | 0.74 | 19.86 | 24.05 | 25.40 | 310.27 | 0.5308 | -678.0 | -500.3 | |
| 0.00 | 2.89 | 0.00 | 1.63 | 15.19 | 22.73 | 24.08 | 303.86 | 0.4761 | -791.0 | -691.1 | |
| 0.00 | 0.90 | 0.00 | 0.53 | 20.57 | 23.35 | 24.70 | 312.10 | 0.5293 | -721.0 | -598.8 | |
| 0.00 | 0.54 | 0.00 | 0.31 | 19.63 | 22.58 | 23.94 | 311.50 | 0.5122 | -652.0 | -556.7 | |
| 0.00 | 0.99 | 0.00 | 0.58 | 21.19 | 21.92 | 23.27 | 314.62 | 0.5196 | -587.0 | -400.5 | |
| 15.10 | 142.44 | 8.47 | 79.90 | 16.87 | 21.21 | 22.57 | 308.52 | 0.4713 | -1141.4 | -461.1 | |
| 0.00 | 1.27 | 0.00 | 0.74 | 21.62 | 21.88 | 23.23 | 315.29 | 0.5233 | -638.0 | -498.1 | |
| 0.00 | 1.36 | 0.00 | 0.78 | 21.29 | 21.72 | 23.07 | 315.00 | 0.5184 | -710.0 | -573.3 | |
| 0.00 | 1.09 | 0.00 | 0.62 | 19.82 | 21.42 | 22.77 | 313.14 | 0.5010 | -694.0 | -533.8 | |
| 6.60 | -9.00 | 3.71 | -9.00 | 17.29 | 21.03 | 22.38 | 309.46 | 0.4728 | -860.9 | 999999 | |
| 2.89 | -9.00 | 1.62 | -9.00 | 17.03 | 20.75 | 22.10 | 309.35 | 0.4672 | -1118.5 | 999999 | |
| 0.00 | 2.35 | 0.00 | 1.31 | 17.89 | 19.86 | 21.22 | 311.93 | 0.4648 | -954.0 | -732.0 | |
| 0.00 | 2.62 | 0.00 | 1.43 | 16.77 | 17.13 | 18.48 | 313.77 | 0.4220 | -652.0 | -645.1 | |
| 0.00 | 2.53 | 0.00 | 1.40 | 19.27 | 16.18 | 17.53 | 319.43 | 0.4391 | 678.0 | 637.2 | |
| 0.00 | 1.27 | 0.00 | 0.68 | 16.39 | 15.39 | 16.74 | 315.81 | 0.3982 | 620.0 | 467.4 | |
| 1.36 | 12.39 | 0.74 | 6.75 | 18.43 | 15.09 | 16.44 | 319.86 | 0.4182 | 691.9 | 702.5 | |
| 3.62 | -19.00 | 1.97 | -19.00 | 18.40 | 14.81 | 16.17 | 320.26 | 0.4150 | 999.2 | 999999 | |
| 0.00 | 0.90 | 0.00 | 0.49 | 19.39 | 14.65 | 16.00 | 322.13 | 0.4252 | 760.0 | 602.9 | |
| 0.00 | 3.07 | 0.00 | 1.68 | 19.14 | 14.45 | 15.80 | 322.06 | 0.4202 | 847.0 | 712.0 | |
| 0.00 | 1.36 | 0.00 | 0.74 | 18.52 | 14.33 | 15.68 | 321.31 | 0.4116 | 856.0 | 697.0 | |
| 0.00 | 1.18 | 0.00 | 0.64 | 19.01 | 14.24 | 15.59 | 322.22 | 0.4166 | 810.0 | 708.0 | |
| 0.00 | 1.27 | 0.00 | 0.68 | 16.20 | 13.66 | 15.02 | 318.49 | 0.3770 | 760.0 | 576.9 | |
| Proj. U | - Projected umbra area in millionths of solar disc, negative values indicate | |
|
that the umbra consists of fragmented regions which cannot be separated without losing umbral area. In this way several spots (intensity minima in the umbra) have a common umbra, e.g. -2 means that the given spot shares an umbra with spot No.2, and the common U value is indicated at spot No.2. |
||
| Proj. WS | - Projected whole spot area in millionths of solar disc, negative values indicate | |
|
that several umbras have a common penumbra, e.g. -7 means that the given umbra shares a penumbra with umbra No.7, and the WS value is indicated at No.7. |
||
| Corr. U | - Corrected umbra area in millionths of solar hemisphere, for negative values see above | |
| Corr. WS | - Corrected whole spot area in millionths of solar hemisphere, for negative values see above | |
| B | - Heliographic latitude B; positive: North, negative: South | |
| L | - Heliographic longitude L | |
| LCM | - Longitudinal distance from the Sun's central meridian | |
| Pos. angle | - Position angle | |
| r | - Distance from the centre of Sun's disc in terms of Sun's radius | |
| MU | - Mean magnetic field within the umbra contour averaged the pixel values with sign. | |
| MP | - Mean magnetic field within the penumbra contour averaged the pixel values with sign. | |