SDO HMI 2011-06-05 23:59:10 UT
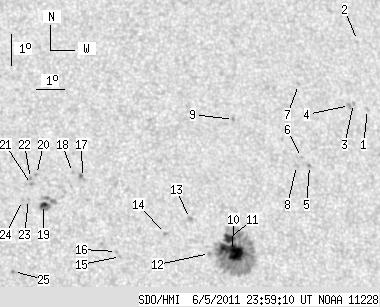
See sunspots with tool (Click here to study sunspot positions and configurations with tool using white-light and magnetogram images and polarity drawing)
(It is recommended to set high resolution on your display!)
| group | Proj. U | Proj. WS | Corr. U | Corr. WS | B | L | LCM | Pos. angle | r | MU | MP |
| 34.01 | 186.11 | 19.17 | 105.17 | 17.50 | 20.46 | 22.92 | 309.34 | 0.4815 | -450.0 | -279.3 | |
|
previous
or next observation for the same group /
back to the solar disc SDO HMI 2011-06-05 23:59:10 UT
See sunspots with tool (Click here to study sunspot positions and configurations with tool using white-light and magnetogram images and polarity drawing) (It is recommended to set high resolution on your display!) |
| spot | Proj. U | Proj. WS | Corr. U | Corr. WS | B | L | LCM | Pos. angle | r | MU | MP |
| 0.00 | 1.72 | 0.00 | 1.05 | 21.48 | 26.74 | 29.20 | 309.02 | 0.5865 | -572.0 | -507.2 | |
| 0.00 | 0.36 | 0.00 | 0.22 | 23.76 | 26.90 | 29.36 | 312.04 | 0.6064 | 522.0 | 570.0 | |
| 0.00 | 1.45 | 0.00 | 0.88 | 21.67 | 26.26 | 28.72 | 309.73 | 0.5828 | -692.0 | -604.8 | |
| 0.00 | 2.62 | 0.00 | 1.59 | 21.61 | 26.10 | 28.56 | 309.78 | 0.5805 | -878.0 | -621.9 | |
| 0.00 | 1.36 | 0.00 | 0.80 | 19.65 | 24.24 | 26.70 | 308.63 | 0.5437 | -771.0 | -675.4 | |
| 0.00 | 1.00 | 0.00 | 0.59 | 19.91 | 24.00 | 26.46 | 309.26 | 0.5431 | -654.0 | -504.1 | |
| 0.00 | 1.18 | 0.00 | 0.71 | 22.29 | 24.35 | 26.81 | 312.41 | 0.5673 | 307.0 | 409.4 | |
| 0.00 | 2.17 | 0.00 | 1.27 | 19.65 | 23.77 | 26.23 | 309.09 | 0.5383 | -673.0 | -508.5 | |
| 0.00 | 1.63 | 0.00 | 0.95 | 21.14 | 21.77 | 24.23 | 313.44 | 0.5292 | -792.0 | -653.4 | |
| 24.06 | 139.94 | 13.60 | 79.13 | 16.89 | 21.08 | 23.54 | 307.42 | 0.4831 | -1117.4 | -414.0 | |
| 6.69 | -10.00 | 3.79 | -10.00 | 17.30 | 21.00 | 23.46 | 308.22 | 0.4857 | -866.8 | 999999 | |
| 0.00 | 1.72 | 0.00 | 0.97 | 16.82 | 20.28 | 22.74 | 308.22 | 0.4728 | -741.0 | -536.1 | |
| 0.00 | 2.53 | 0.00 | 1.43 | 17.94 | 19.73 | 22.19 | 310.78 | 0.4764 | -923.0 | -606.4 | |
| 0.00 | 1.81 | 0.00 | 1.01 | 17.46 | 18.84 | 21.30 | 311.06 | 0.4615 | -769.0 | -629.7 | |
| 0.00 | 1.09 | 0.00 | 0.60 | 16.72 | 17.23 | 19.69 | 311.92 | 0.4354 | -789.0 | -597.8 | |
| 0.00 | 0.54 | 0.00 | 0.30 | 16.88 | 17.11 | 19.57 | 312.37 | 0.4357 | -692.0 | -494.7 | |
| 0.00 | 1.90 | 0.00 | 1.05 | 19.25 | 16.23 | 18.69 | 317.63 | 0.4507 | 757.0 | 677.0 | |
| 0.00 | 1.09 | 0.00 | 0.60 | 19.41 | 15.91 | 18.37 | 318.36 | 0.4492 | 636.0 | 494.3 | |
| 3.26 | 14.38 | 1.78 | 7.88 | 18.38 | 14.81 | 17.27 | 318.39 | 0.4261 | 973.8 | 641.0 | |
| 0.00 | 1.27 | 0.00 | 0.70 | 19.35 | 14.68 | 17.14 | 320.16 | 0.4358 | 817.0 | 679.4 | |
| 0.00 | 1.27 | 0.00 | 0.69 | 19.02 | 14.48 | 16.94 | 319.97 | 0.4300 | 976.0 | 825.8 | |
| 0.00 | 1.09 | 0.00 | 0.60 | 19.22 | 14.46 | 16.92 | 320.30 | 0.4321 | 831.0 | 694.8 | |
| 0.00 | 1.18 | 0.00 | 0.64 | 18.54 | 14.33 | 16.79 | 319.44 | 0.4229 | 710.0 | 644.3 | |
| 0.00 | 1.00 | 0.00 | 0.54 | 18.51 | 14.12 | 16.58 | 319.73 | 0.4204 | 746.0 | 633.0 | |
| 0.00 | 1.81 | 0.00 | 0.97 | 16.24 | 13.62 | 16.08 | 316.66 | 0.3890 | 864.0 | 688.6 | |
| Proj. U | - Projected umbra area in millionths of solar disc, negative values indicate | |
|
that the umbra consists of fragmented regions which cannot be separated without losing umbral area. In this way several spots (intensity minima in the umbra) have a common umbra, e.g. -2 means that the given spot shares an umbra with spot No.2, and the common U value is indicated at spot No.2. |
||
| Proj. WS | - Projected whole spot area in millionths of solar disc, negative values indicate | |
|
that several umbras have a common penumbra, e.g. -7 means that the given umbra shares a penumbra with umbra No.7, and the WS value is indicated at No.7. |
||
| Corr. U | - Corrected umbra area in millionths of solar hemisphere, for negative values see above | |
| Corr. WS | - Corrected whole spot area in millionths of solar hemisphere, for negative values see above | |
| B | - Heliographic latitude B; positive: North, negative: South | |
| L | - Heliographic longitude L | |
| LCM | - Longitudinal distance from the Sun's central meridian | |
| Pos. angle | - Position angle | |
| r | - Distance from the centre of Sun's disc in terms of Sun's radius | |
| MU | - Mean magnetic field within the umbra contour averaged the pixel values with sign. | |
| MP | - Mean magnetic field within the penumbra contour averaged the pixel values with sign. | |