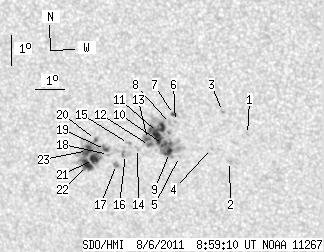
SDO HMI 2011-08-06 08:59:10 UT
See sunspots with tool (Click here to study sunspot positions and configurations with tool using white-light and magnetogram images and polarity drawing)
(It is recommended to set high resolution on your display!)
| group | Proj. U | Proj. WS | Corr. U | Corr. WS | B | L | LCM | Pos. angle | r | MU | MP |
| 50.01 | 169.10 | 29.41 | 99.28 | -16.43 | 241.78 | -23.60 | 134.36 | 0.5388 | -54.2 | -193.8 | |
|
previous
or next observation for the same group /
back to the solar disc SDO HMI 2011-08-06 08:59:10 UT
See sunspots with tool (Click here to study sunspot positions and configurations with tool using white-light and magnetogram images and polarity drawing) (It is recommended to set high resolution on your display!) |
| spot | Proj. U | Proj. WS | Corr. U | Corr. WS | B | L | LCM | Pos. angle | r | MU | MP |
| 0.00 | 1.54 | 0.00 | 0.87 | -15.92 | 245.75 | -19.62 | 138.84 | 0.4926 | 741.0 | 577.6 | |
| 0.00 | 1.36 | 0.00 | 0.78 | -16.84 | 245.05 | -20.33 | 139.09 | 0.5098 | 572.0 | 513.3 | |
| 0.00 | 1.45 | 0.00 | 0.82 | -15.20 | 244.98 | -20.39 | 136.73 | 0.4925 | 794.0 | 722.8 | |
| 0.00 | 0.45 | 0.00 | 0.26 | -16.43 | 244.48 | -20.90 | 137.77 | 0.5110 | -847.0 | -672.8 | |
| 0.00 | 0.81 | 0.00 | 0.47 | -16.74 | 243.35 | -22.02 | 136.70 | 0.5257 | -616.0 | -518.1 | |
| 0.00 | 0.99 | 0.00 | 0.57 | -15.59 | 243.35 | -22.03 | 135.10 | 0.5138 | 529.0 | 540.2 | |
| 1.54 | 2.44 | 0.89 | 1.41 | -15.36 | 243.31 | -22.07 | 134.72 | 0.5119 | 860.4 | 707.3 | |
| 0.00 | 2.98 | 0.00 | 1.72 | -15.66 | 243.17 | -22.20 | 134.98 | 0.5164 | 674.0 | 640.5 | |
| 2.62 | 80.67 | 1.53 | 46.90 | -16.62 | 243.02 | -22.35 | 136.12 | 0.5278 | -1081.2 | 41.7 | |
| 1.99 | -9.00 | 1.16 | -9.00 | -16.37 | 242.85 | -22.53 | 135.55 | 0.5270 | 523.1 | 999999 | |
| 17.36 | -9.00 | 10.09 | -9.00 | -15.98 | 242.69 | -22.69 | 134.81 | 0.5247 | 934.8 | 999999 | |
| 1.72 | -9.00 | 1.00 | -9.00 | -16.42 | 242.36 | -23.02 | 135.02 | 0.5326 | -361.6 | 999999 | |
| 2.17 | -9.00 | 1.27 | -9.00 | -16.23 | 242.32 | -23.06 | 134.69 | 0.5311 | 417.0 | 999999 | |
| 0.00 | 1.99 | 0.00 | 1.17 | -16.54 | 241.93 | -23.45 | 134.66 | 0.5383 | 494.0 | 306.8 | |
| 0.00 | 2.98 | 0.00 | 1.75 | -16.39 | 241.64 | -23.74 | 134.10 | 0.5399 | 491.0 | 181.6 | |
| 0.00 | 5.06 | 0.00 | 2.99 | -16.76 | 241.49 | -23.89 | 134.42 | 0.5451 | -499.0 | -507.0 | |
| 0.00 | 2.89 | 0.00 | 1.72 | -17.10 | 241.12 | -24.25 | 134.47 | 0.5522 | -917.0 | -783.4 | |
| 0.00 | 2.17 | 0.00 | 1.29 | -16.78 | 240.89 | -24.49 | 133.76 | 0.5516 | -618.0 | -595.1 | |
| 2.53 | 61.32 | 1.50 | 36.56 | -16.62 | 240.81 | -24.57 | 133.45 | 0.5509 | -1000.3 | -640.3 | |
| 1.63 | -19.00 | 0.96 | -19.00 | -16.31 | 240.50 | -24.88 | 132.67 | 0.5512 | -879.1 | 999999 | |
| 5.16 | -19.00 | 3.07 | -19.00 | -16.97 | 240.34 | -25.04 | 133.39 | 0.5592 | -987.4 | 999999 | |
| 7.05 | -19.00 | 4.22 | -19.00 | -17.18 | 240.09 | -25.28 | 133.41 | 0.5637 | -795.9 | 999999 | |
| 6.24 | -19.00 | 3.72 | -19.00 | -16.69 | 240.17 | -25.21 | 132.81 | 0.5583 | -974.6 | 999999 | |
| Proj. U | - Projected umbra area in millionths of solar disc, negative values indicate | |
|
that the umbra consists of fragmented regions which cannot be separated without losing umbral area. In this way several spots (intensity minima in the umbra) have a common umbra, e.g. -2 means that the given spot shares an umbra with spot No.2, and the common U value is indicated at spot No.2. |
||
| Proj. WS | - Projected whole spot area in millionths of solar disc, negative values indicate | |
|
that several umbras have a common penumbra, e.g. -7 means that the given umbra shares a penumbra with umbra No.7, and the WS value is indicated at No.7. |
||
| Corr. U | - Corrected umbra area in millionths of solar hemisphere, for negative values see above | |
| Corr. WS | - Corrected whole spot area in millionths of solar hemisphere, for negative values see above | |
| B | - Heliographic latitude B; positive: North, negative: South | |
| L | - Heliographic longitude L | |
| LCM | - Longitudinal distance from the Sun's central meridian | |
| Pos. angle | - Position angle | |
| r | - Distance from the centre of Sun's disc in terms of Sun's radius | |
| MU | - Mean magnetic field within the umbra contour averaged the pixel values with sign. | |
| MP | - Mean magnetic field within the penumbra contour averaged the pixel values with sign. | |