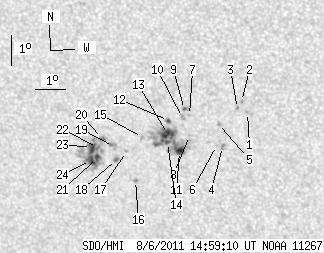
SDO HMI 2011-08-06 14:59:10 UT
See sunspots with tool (Click here to study sunspot positions and configurations with tool using white-light and magnetogram images and polarity drawing)
(It is recommended to set high resolution on your display!)
| group | Proj. U | Proj. WS | Corr. U | Corr. WS | B | L | LCM | Pos. angle | r | MU | MP |
| 35.79 | 153.03 | 20.59 | 87.76 | -16.50 | 241.88 | -20.20 | 138.88 | 0.5049 | -118.7 | -75.7 | |
|
previous
or next observation for the same group /
back to the solar disc SDO HMI 2011-08-06 14:59:10 UT
See sunspots with tool (Click here to study sunspot positions and configurations with tool using white-light and magnetogram images and polarity drawing) (It is recommended to set high resolution on your display!) |
| spot | Proj. U | Proj. WS | Corr. U | Corr. WS | B | L | LCM | Pos. angle | r | MU | MP |
| 0.00 | 1.36 | 0.00 | 0.75 | -15.35 | 245.47 | -16.60 | 142.71 | 0.4567 | 849.0 | 679.6 | |
| 0.00 | 1.36 | 0.00 | 0.75 | -15.00 | 245.30 | -16.77 | 141.94 | 0.4540 | 799.0 | 686.7 | |
| 0.00 | 1.36 | 0.00 | 0.75 | -15.23 | 245.15 | -16.92 | 142.02 | 0.4583 | 852.0 | 673.1 | |
| 0.00 | 2.71 | 0.00 | 1.53 | -16.50 | 244.54 | -17.53 | 142.76 | 0.4792 | -1001.0 | -822.7 | |
| 0.00 | 1.45 | 0.00 | 0.81 | -15.75 | 244.47 | -17.60 | 141.65 | 0.4708 | 579.0 | 376.2 | |
| 0.00 | 0.72 | 0.00 | 0.41 | -16.47 | 244.34 | -17.73 | 142.41 | 0.4807 | -676.0 | -616.0 | |
| 0.00 | 1.27 | 0.00 | 0.71 | -15.52 | 243.53 | -18.54 | 139.87 | 0.4773 | 715.0 | 499.3 | |
| 0.00 | 0.72 | 0.00 | 0.41 | -16.17 | 243.47 | -18.60 | 140.68 | 0.4855 | 539.0 | 438.5 | |
| 1.45 | 2.35 | 0.81 | 1.32 | -15.33 | 243.38 | -18.69 | 139.38 | 0.4766 | 850.6 | 730.5 | |
| 0.00 | 2.44 | 0.00 | 1.38 | -15.59 | 243.29 | -18.78 | 139.62 | 0.4805 | 887.0 | 701.0 | |
| 4.43 | 68.15 | 2.52 | 38.79 | -16.71 | 243.08 | -18.99 | 140.83 | 0.4955 | -950.1 | 204.9 | |
| 1.54 | 2.53 | 0.87 | 1.43 | -15.71 | 242.81 | -19.26 | 139.07 | 0.4866 | 785.1 | 811.5 | |
| 7.05 | -11.00 | 4.01 | -11.00 | -16.14 | 242.74 | -19.34 | 139.55 | 0.4922 | 1124.2 | 999999 | |
| 1.90 | -11.00 | 1.08 | -11.00 | -16.43 | 242.71 | -19.37 | 139.91 | 0.4959 | 737.2 | 999999 | |
| 0.00 | 1.63 | 0.00 | 0.93 | -16.30 | 241.88 | -20.19 | 138.55 | 0.5025 | 763.0 | 517.7 | |
| 0.00 | 1.08 | 0.00 | 0.63 | -17.74 | 241.47 | -20.60 | 139.91 | 0.5223 | -743.0 | -568.2 | |
| 0.00 | 1.36 | 0.00 | 0.78 | -16.78 | 241.28 | -20.79 | 138.39 | 0.5138 | -708.0 | -524.4 | |
| 2.26 | 3.34 | 1.31 | 1.94 | -17.06 | 240.91 | -21.16 | 138.26 | 0.5205 | -713.2 | -576.2 | |
| 0.00 | 4.43 | 0.00 | 2.56 | -16.64 | 240.86 | -21.22 | 137.62 | 0.5164 | -868.0 | -827.3 | |
| 2.26 | 54.77 | 1.31 | 31.88 | -16.39 | 240.51 | -21.56 | 136.82 | 0.5173 | -925.4 | -519.6 | |
| 2.98 | -20.00 | 1.74 | -20.00 | -17.02 | 240.26 | -21.81 | 137.36 | 0.5265 | -1023.5 | 999999 | |
| 0.90 | -20.00 | 0.52 | -20.00 | -16.69 | 240.30 | -21.77 | 136.97 | 0.5226 | -1019.5 | 999999 | |
| 5.78 | -20.00 | 3.36 | -20.00 | -16.70 | 240.10 | -21.98 | 136.71 | 0.5248 | -943.7 | 999999 | |
| 5.24 | -20.00 | 3.06 | -20.00 | -17.13 | 240.01 | -22.06 | 137.18 | 0.5302 | -858.7 | 999999 | |
| Proj. U | - Projected umbra area in millionths of solar disc, negative values indicate | |
|
that the umbra consists of fragmented regions which cannot be separated without losing umbral area. In this way several spots (intensity minima in the umbra) have a common umbra, e.g. -2 means that the given spot shares an umbra with spot No.2, and the common U value is indicated at spot No.2. |
||
| Proj. WS | - Projected whole spot area in millionths of solar disc, negative values indicate | |
|
that several umbras have a common penumbra, e.g. -7 means that the given umbra shares a penumbra with umbra No.7, and the WS value is indicated at No.7. |
||
| Corr. U | - Corrected umbra area in millionths of solar hemisphere, for negative values see above | |
| Corr. WS | - Corrected whole spot area in millionths of solar hemisphere, for negative values see above | |
| B | - Heliographic latitude B; positive: North, negative: South | |
| L | - Heliographic longitude L | |
| LCM | - Longitudinal distance from the Sun's central meridian | |
| Pos. angle | - Position angle | |
| r | - Distance from the centre of Sun's disc in terms of Sun's radius | |
| MU | - Mean magnetic field within the umbra contour averaged the pixel values with sign. | |
| MP | - Mean magnetic field within the penumbra contour averaged the pixel values with sign. | |