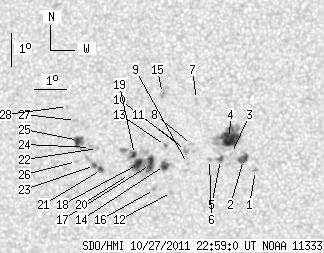
SDO HMI 2011-10-27 22:59:00 UT
See sunspots with tool (Click here to study sunspot positions and configurations with tool using white-light and magnetogram images and polarity drawing)
(It is recommended to set high resolution on your display!)
| group | Proj. U | Proj. WS | Corr. U | Corr. WS | B | L | LCM | Pos. angle | r | MU | MP |
| 61.33 | 165.91 | 31.50 | 85.32 | 14.74 | 243.00 | -11.99 | 48.85 | 0.2676 | -43.8 | -0.9 | |
|
previous
or next observation for the same group /
back to the solar disc SDO HMI 2011-10-27 22:59:00 UT
See sunspots with tool (Click here to study sunspot positions and configurations with tool using white-light and magnetogram images and polarity drawing) (It is recommended to set high resolution on your display!) |
| spot | Proj. U | Proj. WS | Corr. U | Corr. WS | B | L | LCM | Pos. angle | r | MU | MP |
| 0.00 | 1.82 | 0.00 | 0.93 | 14.23 | 245.80 | -9.20 | 43.31 | 0.2269 | -1027.0 | -774.5 | |
| 6.07 | 8.24 | 3.09 | 4.20 | 14.56 | 245.41 | -9.58 | 43.47 | 0.2353 | -1061.7 | -854.8 | |
| 0.00 | 1.30 | 0.00 | 0.66 | 14.73 | 245.02 | -9.97 | 44.03 | 0.2419 | -644.0 | -502.1 | |
| 19.26 | 40.25 | 9.84 | 20.58 | 15.19 | 244.94 | -10.05 | 42.95 | 0.2483 | -1110.0 | -456.2 | |
| 1.82 | 4.51 | 0.93 | 2.30 | 14.55 | 244.69 | -10.30 | 45.51 | 0.2438 | -816.8 | -307.9 | |
| 0.00 | 1.82 | 0.00 | 0.93 | 14.54 | 244.35 | -10.65 | 46.44 | 0.2479 | -859.0 | -577.9 | |
| 0.00 | 1.13 | 0.00 | 0.58 | 16.35 | 243.84 | -11.15 | 42.69 | 0.2750 | -806.0 | -714.1 | |
| 0.00 | 1.30 | 0.00 | 0.67 | 14.99 | 243.76 | -11.23 | 46.62 | 0.2601 | 699.0 | 499.6 | |
| 0.00 | 1.04 | 0.00 | 0.53 | 14.41 | 243.66 | -11.33 | 48.56 | 0.2549 | -674.0 | -412.0 | |
| 0.00 | 2.69 | 0.00 | 1.38 | 14.80 | 243.58 | -11.41 | 47.60 | 0.2603 | 918.0 | 814.6 | |
| 0.00 | 1.47 | 0.00 | 0.76 | 15.01 | 243.32 | -11.68 | 47.62 | 0.2658 | 818.0 | 647.0 | |
| 0.00 | 1.56 | 0.00 | 0.80 | 13.53 | 243.21 | -11.79 | 52.41 | 0.2518 | 905.0 | 630.1 | |
| 0.35 | 1.73 | 0.18 | 0.89 | 14.94 | 242.94 | -12.05 | 48.68 | 0.2698 | -416.0 | -224.4 | |
| 5.29 | 7.11 | 2.72 | 3.65 | 14.34 | 242.94 | -12.05 | 50.46 | 0.2634 | 1083.8 | 600.4 | |
| 0.00 | 3.73 | 0.00 | 1.93 | 16.52 | 242.75 | -12.24 | 44.85 | 0.2895 | 1026.0 | 844.5 | |
| 0.00 | 1.56 | 0.00 | 0.80 | 13.61 | 242.67 | -12.32 | 53.33 | 0.2598 | 907.0 | 726.7 | |
| 8.59 | 53.35 | 4.42 | 27.47 | 14.36 | 242.50 | -12.49 | 51.37 | 0.2694 | 1051.5 | -238.3 | |
| 7.37 | -17.00 | 3.80 | -17.00 | 14.35 | 242.09 | -12.90 | 52.25 | 0.2747 | -1029.8 | 999999 | |
| 2.34 | -17.00 | 1.21 | -17.00 | 14.65 | 241.98 | -13.01 | 51.60 | 0.2792 | -1026.7 | 999999 | |
| 0.00 | 1.47 | 0.00 | 0.76 | 14.05 | 241.86 | -13.13 | 53.64 | 0.2749 | 642.0 | 510.3 | |
| 2.34 | 9.37 | 1.21 | 4.85 | 14.18 | 240.97 | -14.03 | 54.95 | 0.2883 | 1122.3 | 858.4 | |
| 0.00 | 1.39 | 0.00 | 0.72 | 14.81 | 240.80 | -14.19 | 53.44 | 0.2964 | 623.0 | 543.4 | |
| 1.65 | -21.00 | 0.85 | -21.00 | 14.30 | 240.74 | -14.25 | 55.02 | 0.2925 | 1007.6 | 999999 | |
| 0.00 | 3.21 | 0.00 | 1.67 | 14.84 | 240.57 | -14.42 | 53.78 | 0.2997 | 567.0 | 621.8 | |
| 6.25 | 11.19 | 3.25 | 5.82 | 15.04 | 240.18 | -14.81 | 53.92 | 0.3069 | 941.2 | 779.8 | |
| 0.00 | 1.73 | 0.00 | 0.90 | 14.40 | 240.16 | -14.83 | 55.72 | 0.3014 | 782.0 | 507.6 | |
| 0.00 | 1.73 | 0.00 | 0.90 | 15.64 | 240.04 | -14.95 | 52.55 | 0.3144 | 885.0 | 695.8 | |
| 0.00 | 1.21 | 0.00 | 0.64 | 16.06 | 239.75 | -15.24 | 51.97 | 0.3222 | 812.0 | 602.1 | |
| Proj. U | - Projected umbra area in millionths of solar disc, negative values indicate | |
|
that the umbra consists of fragmented regions which cannot be separated without losing umbral area. In this way several spots (intensity minima in the umbra) have a common umbra, e.g. -2 means that the given spot shares an umbra with spot No.2, and the common U value is indicated at spot No.2. |
||
| Proj. WS | - Projected whole spot area in millionths of solar disc, negative values indicate | |
|
that several umbras have a common penumbra, e.g. -7 means that the given umbra shares a penumbra with umbra No.7, and the WS value is indicated at No.7. |
||
| Corr. U | - Corrected umbra area in millionths of solar hemisphere, for negative values see above | |
| Corr. WS | - Corrected whole spot area in millionths of solar hemisphere, for negative values see above | |
| B | - Heliographic latitude B; positive: North, negative: South | |
| L | - Heliographic longitude L | |
| LCM | - Longitudinal distance from the Sun's central meridian | |
| Pos. angle | - Position angle | |
| r | - Distance from the centre of Sun's disc in terms of Sun's radius | |
| MU | - Mean magnetic field within the umbra contour averaged the pixel values with sign. | |
| MP | - Mean magnetic field within the penumbra contour averaged the pixel values with sign. | |