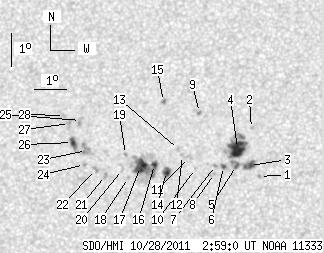
SDO HMI 2011-10-28 02:59:00 UT
See sunspots with tool (Click here to study sunspot positions and configurations with tool using white-light and magnetogram images and polarity drawing)
(It is recommended to set high resolution on your display!)
| group | Proj. U | Proj. WS | Corr. U | Corr. WS | B | L | LCM | Pos. angle | r | MU | MP |
| 50.33 | 160.02 | 25.64 | 81.69 | 14.78 | 242.96 | -9.83 | 42.94 | 0.2422 | -264.3 | 18.5 | |
|
previous
or next observation for the same group /
back to the solar disc SDO HMI 2011-10-28 02:59:00 UT
See sunspots with tool (Click here to study sunspot positions and configurations with tool using white-light and magnetogram images and polarity drawing) (It is recommended to set high resolution on your display!) |
| spot | Proj. U | Proj. WS | Corr. U | Corr. WS | B | L | LCM | Pos. angle | r | MU | MP |
| 0.00 | 1.39 | 0.00 | 0.70 | 14.18 | 245.89 | -6.90 | 35.47 | 0.2016 | -954.0 | -733.7 | |
| 0.00 | 1.21 | 0.00 | 0.62 | 15.63 | 245.60 | -7.20 | 32.63 | 0.2247 | -738.0 | -607.6 | |
| 4.08 | 14.67 | 2.07 | 7.43 | 14.51 | 245.57 | -7.22 | 35.73 | 0.2093 | -1136.4 | -797.6 | |
| 17.96 | 33.67 | 9.12 | 17.10 | 15.02 | 245.18 | -7.61 | 35.70 | 0.2202 | -1159.7 | -652.9 | |
| 1.30 | -3.00 | 0.66 | -3.00 | 14.51 | 245.17 | -7.62 | 37.21 | 0.2133 | -977.3 | 999999 | |
| 1.82 | 2.43 | 0.92 | 1.23 | 14.47 | 244.77 | -8.02 | 38.72 | 0.2171 | -852.2 | -770.1 | |
| 0.00 | 1.04 | 0.00 | 0.53 | 14.50 | 244.52 | -8.27 | 39.48 | 0.2201 | -795.0 | -646.2 | |
| 0.00 | 0.95 | 0.00 | 0.48 | 14.26 | 244.50 | -8.30 | 40.29 | 0.2173 | -858.0 | -681.3 | |
| 0.00 | 1.91 | 0.00 | 0.98 | 16.10 | 243.95 | -8.84 | 36.89 | 0.2471 | -1028.0 | -803.0 | |
| 0.00 | 1.04 | 0.00 | 0.53 | 14.40 | 243.90 | -8.89 | 41.78 | 0.2258 | -640.0 | -527.9 | |
| 0.00 | 2.60 | 0.00 | 1.33 | 14.73 | 243.70 | -9.09 | 41.41 | 0.2321 | 666.0 | 635.9 | |
| 0.00 | 1.39 | 0.00 | 0.71 | 14.79 | 243.48 | -9.31 | 41.91 | 0.2353 | 683.0 | 614.0 | |
| 0.00 | 2.00 | 0.00 | 1.02 | 14.97 | 243.34 | -9.45 | 41.78 | 0.2391 | 690.0 | 491.7 | |
| 4.60 | 6.42 | 2.34 | 3.27 | 14.30 | 243.00 | -9.79 | 44.79 | 0.2350 | 1041.2 | 779.3 | |
| 1.39 | 2.52 | 0.71 | 1.29 | 16.42 | 242.80 | -9.99 | 39.42 | 0.2632 | 929.2 | 871.0 | |
| 2.26 | 49.64 | 1.15 | 25.35 | 14.50 | 242.62 | -10.18 | 45.23 | 0.2420 | 882.9 | -61.3 | |
| 11.80 | -16.00 | 6.03 | -16.00 | 14.44 | 242.18 | -10.61 | 46.60 | 0.2465 | -1140.6 | 999999 | |
| 0.00 | 1.04 | 0.00 | 0.53 | 14.10 | 241.82 | -10.97 | 48.56 | 0.2473 | 791.0 | 495.7 | |
| 0.00 | 1.39 | 0.00 | 0.71 | 14.79 | 241.69 | -11.10 | 46.78 | 0.2565 | -712.0 | -496.8 | |
| 0.00 | 1.74 | 0.00 | 0.89 | 14.34 | 241.62 | -11.17 | 48.32 | 0.2524 | -815.0 | -499.1 | |
| 0.00 | 2.34 | 0.00 | 1.20 | 14.15 | 241.10 | -11.69 | 50.16 | 0.2571 | 1232.0 | 928.2 | |
| 0.00 | 2.95 | 0.00 | 1.51 | 14.32 | 240.78 | -12.02 | 50.37 | 0.2631 | 1011.0 | 812.2 | |
| 0.00 | 7.12 | 0.00 | 3.66 | 14.89 | 240.46 | -12.33 | 49.39 | 0.2731 | 796.0 | 921.1 | |
| 0.00 | 0.95 | 0.00 | 0.49 | 14.47 | 240.42 | -12.37 | 50.72 | 0.2692 | 1018.0 | 849.9 | |
| 0.00 | 3.64 | 0.00 | 1.88 | 15.80 | 240.22 | -12.58 | 47.42 | 0.2858 | 714.0 | 698.6 | |
| 5.12 | 7.90 | 2.64 | 4.07 | 15.13 | 240.00 | -12.79 | 49.72 | 0.2814 | 976.5 | 840.3 | |
| 0.00 | 6.16 | 0.00 | 3.19 | 15.70 | 239.87 | -12.92 | 48.42 | 0.2891 | 956.0 | 711.8 | |
| 0.00 | 1.91 | 0.00 | 0.99 | 15.94 | 239.70 | -13.09 | 48.14 | 0.2938 | 729.0 | 588.3 | |
| Proj. U | - Projected umbra area in millionths of solar disc, negative values indicate | |
|
that the umbra consists of fragmented regions which cannot be separated without losing umbral area. In this way several spots (intensity minima in the umbra) have a common umbra, e.g. -2 means that the given spot shares an umbra with spot No.2, and the common U value is indicated at spot No.2. |
||
| Proj. WS | - Projected whole spot area in millionths of solar disc, negative values indicate | |
|
that several umbras have a common penumbra, e.g. -7 means that the given umbra shares a penumbra with umbra No.7, and the WS value is indicated at No.7. |
||
| Corr. U | - Corrected umbra area in millionths of solar hemisphere, for negative values see above | |
| Corr. WS | - Corrected whole spot area in millionths of solar hemisphere, for negative values see above | |
| B | - Heliographic latitude B; positive: North, negative: South | |
| L | - Heliographic longitude L | |
| LCM | - Longitudinal distance from the Sun's central meridian | |
| Pos. angle | - Position angle | |
| r | - Distance from the centre of Sun's disc in terms of Sun's radius | |
| MU | - Mean magnetic field within the umbra contour averaged the pixel values with sign. | |
| MP | - Mean magnetic field within the penumbra contour averaged the pixel values with sign. | |