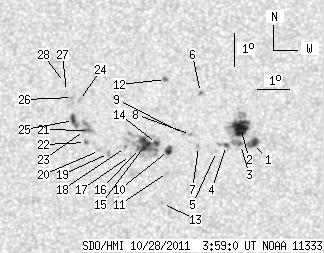
SDO HMI 2011-10-28 03:59:00 UT
See sunspots with tool (Click here to study sunspot positions and configurations with tool using white-light and magnetogram images and polarity drawing)
(It is recommended to set high resolution on your display!)
| group | Proj. U | Proj. WS | Corr. U | Corr. WS | B | L | LCM | Pos. angle | r | MU | MP |
| 54.24 | 147.37 | 27.61 | 75.03 | 14.69 | 243.16 | -9.08 | 41.01 | 0.2327 | -120.2 | -46.2 | |
|
previous
or next observation for the same group /
back to the solar disc SDO HMI 2011-10-28 03:59:00 UT
See sunspots with tool (Click here to study sunspot positions and configurations with tool using white-light and magnetogram images and polarity drawing) (It is recommended to set high resolution on your display!) |
| spot | Proj. U | Proj. WS | Corr. U | Corr. WS | B | L | LCM | Pos. angle | r | MU | MP |
| 5.81 | 8.33 | 2.94 | 4.21 | 14.51 | 245.64 | -6.60 | 33.35 | 0.2033 | -1012.9 | -863.0 | |
| 18.23 | 41.22 | 9.24 | 20.90 | 14.99 | 245.23 | -7.02 | 33.64 | 0.2141 | -1168.8 | -634.7 | |
| 1.48 | -2.00 | 0.75 | -2.00 | 14.47 | 245.24 | -7.00 | 35.00 | 0.2067 | -913.5 | 999999 | |
| 2.08 | 4.60 | 1.06 | 2.33 | 14.44 | 244.81 | -7.43 | 36.71 | 0.2106 | -822.8 | -661.3 | |
| 0.00 | 1.04 | 0.00 | 0.53 | 14.25 | 244.50 | -7.74 | 38.35 | 0.2113 | -862.0 | -657.9 | |
| 0.00 | 1.30 | 0.00 | 0.66 | 16.03 | 243.94 | -8.30 | 35.36 | 0.2410 | -1025.0 | -918.2 | |
| 0.00 | 1.82 | 0.00 | 0.93 | 14.40 | 243.94 | -8.30 | 39.86 | 0.2192 | -599.0 | -577.7 | |
| 0.00 | 1.39 | 0.00 | 0.71 | 14.76 | 243.68 | -8.57 | 39.65 | 0.2267 | 910.0 | 611.4 | |
| 0.00 | 1.91 | 0.00 | 0.97 | 14.78 | 243.46 | -8.78 | 40.27 | 0.2295 | 798.0 | 690.8 | |
| 4.34 | 5.81 | 2.21 | 2.96 | 14.26 | 243.01 | -9.23 | 43.22 | 0.2281 | 1046.1 | 681.6 | |
| 0.00 | 1.39 | 0.00 | 0.70 | 13.60 | 243.01 | -9.23 | 45.36 | 0.2202 | 808.0 | 709.8 | |
| 0.43 | 2.00 | 0.22 | 1.02 | 16.41 | 242.82 | -9.42 | 37.81 | 0.2573 | 1133.2 | 893.2 | |
| 0.00 | 1.13 | 0.00 | 0.57 | 12.67 | 242.89 | -9.35 | 48.99 | 0.2111 | 597.0 | 490.2 | |
| 2.17 | 48.34 | 1.11 | 24.65 | 14.47 | 242.63 | -9.61 | 43.72 | 0.2350 | 859.6 | -118.4 | |
| 10.33 | -14.00 | 5.27 | -14.00 | 14.44 | 242.29 | -9.95 | 44.80 | 0.2387 | -1127.5 | 999999 | |
| 2.08 | -14.00 | 1.06 | -14.00 | 14.31 | 242.11 | -10.14 | 45.69 | 0.2394 | -923.2 | 999999 | |
| 0.00 | 1.30 | 0.00 | 0.66 | 14.10 | 241.84 | -10.41 | 47.09 | 0.2403 | 639.0 | 354.2 | |
| 0.00 | 1.30 | 0.00 | 0.66 | 14.34 | 241.67 | -10.58 | 46.79 | 0.2451 | -613.0 | -438.0 | |
| 0.00 | 1.91 | 0.00 | 0.98 | 14.15 | 241.15 | -11.10 | 48.71 | 0.2495 | 1256.0 | 930.9 | |
| 0.00 | 1.13 | 0.00 | 0.58 | 14.23 | 240.86 | -11.38 | 49.15 | 0.2541 | 875.0 | 717.8 | |
| 0.26 | 7.64 | 0.13 | 3.92 | 14.83 | 240.48 | -11.76 | 48.25 | 0.2653 | 1250.3 | 876.7 | |
| 1.13 | 2.00 | 0.58 | 1.02 | 14.47 | 240.41 | -11.84 | 49.50 | 0.2624 | 860.0 | 715.7 | |
| 0.95 | -21.00 | 0.49 | -21.00 | 14.83 | 240.36 | -11.89 | 48.55 | 0.2669 | 1097.7 | 999999 | |
| 0.00 | 1.82 | 0.00 | 0.94 | 15.73 | 240.15 | -12.10 | 46.50 | 0.2794 | 949.0 | 710.0 | |
| 4.95 | 7.29 | 2.55 | 3.75 | 15.13 | 239.99 | -12.25 | 48.53 | 0.2746 | 1008.2 | 898.0 | |
| 0.00 | 1.48 | 0.00 | 0.76 | 15.82 | 239.92 | -12.32 | 46.78 | 0.2831 | 917.0 | 670.8 | |
| 0.00 | 0.61 | 0.00 | 0.31 | 16.00 | 239.72 | -12.53 | 46.75 | 0.2875 | 690.0 | 619.6 | |
| 0.00 | 0.61 | 0.00 | 0.31 | 16.27 | 239.64 | -12.61 | 46.22 | 0.2915 | 668.0 | 515.7 | |
| Proj. U | - Projected umbra area in millionths of solar disc, negative values indicate | |
|
that the umbra consists of fragmented regions which cannot be separated without losing umbral area. In this way several spots (intensity minima in the umbra) have a common umbra, e.g. -2 means that the given spot shares an umbra with spot No.2, and the common U value is indicated at spot No.2. |
||
| Proj. WS | - Projected whole spot area in millionths of solar disc, negative values indicate | |
|
that several umbras have a common penumbra, e.g. -7 means that the given umbra shares a penumbra with umbra No.7, and the WS value is indicated at No.7. |
||
| Corr. U | - Corrected umbra area in millionths of solar hemisphere, for negative values see above | |
| Corr. WS | - Corrected whole spot area in millionths of solar hemisphere, for negative values see above | |
| B | - Heliographic latitude B; positive: North, negative: South | |
| L | - Heliographic longitude L | |
| LCM | - Longitudinal distance from the Sun's central meridian | |
| Pos. angle | - Position angle | |
| r | - Distance from the centre of Sun's disc in terms of Sun's radius | |
| MU | - Mean magnetic field within the umbra contour averaged the pixel values with sign. | |
| MP | - Mean magnetic field within the penumbra contour averaged the pixel values with sign. | |