SDO HMI 2011-10-28 05:59:00 UT
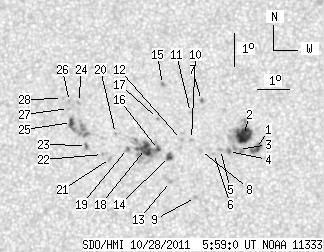
See sunspots with tool (Click here to study sunspot positions and configurations with tool using white-light and magnetogram images and polarity drawing)
(It is recommended to set high resolution on your display!)
| group | Proj. U | Proj. WS | Corr. U | Corr. WS | B | L | LCM | Pos. angle | r | MU | MP |
| 46.70 | 139.76 | 23.70 | 70.97 | 14.73 | 243.08 | -8.07 | 37.43 | 0.2227 | -234.8 | -17.4 | |
|
previous
or next observation for the same group /
back to the solar disc SDO HMI 2011-10-28 05:59:00 UT
See sunspots with tool (Click here to study sunspot positions and configurations with tool using white-light and magnetogram images and polarity drawing) (It is recommended to set high resolution on your display!) |
| spot | Proj. U | Proj. WS | Corr. U | Corr. WS | B | L | LCM | Pos. angle | r | MU | MP |
| 3.82 | 6.86 | 1.93 | 3.46 | 14.50 | 245.72 | -5.43 | 28.43 | 0.1932 | -1149.2 | -892.7 | |
| 17.53 | 34.63 | 8.87 | 17.52 | 14.89 | 245.31 | -5.84 | 29.20 | 0.2024 | -1182.3 | -575.0 | |
| 0.00 | 5.47 | 0.00 | 2.76 | 14.47 | 245.17 | -5.98 | 30.90 | 0.1974 | -819.0 | -790.8 | |
| 0.00 | 2.52 | 0.00 | 1.27 | 14.40 | 244.86 | -6.29 | 32.34 | 0.1992 | -905.0 | -693.3 | |
| 0.00 | 1.74 | 0.00 | 0.88 | 14.46 | 244.61 | -6.54 | 33.18 | 0.2024 | -697.0 | -566.0 | |
| 0.00 | 1.13 | 0.00 | 0.57 | 14.34 | 244.40 | -6.75 | 34.37 | 0.2027 | -736.0 | -565.7 | |
| 1.65 | 1.65 | 0.84 | 0.84 | 15.94 | 243.97 | -7.18 | 31.76 | 0.2293 | -900.1 | 0.0 | |
| 0.00 | 1.65 | 0.00 | 0.83 | 14.43 | 243.99 | -7.16 | 35.67 | 0.2079 | -754.0 | -590.1 | |
| 0.00 | 2.08 | 0.00 | 1.05 | 13.01 | 243.88 | -7.27 | 40.63 | 0.1902 | 913.0 | 714.4 | |
| 0.00 | 1.30 | 0.00 | 0.66 | 14.76 | 243.70 | -7.45 | 35.80 | 0.2153 | 906.0 | 659.2 | |
| 0.00 | 0.61 | 0.00 | 0.31 | 15.57 | 243.64 | -7.51 | 33.82 | 0.2271 | -695.0 | -564.4 | |
| 0.00 | 1.39 | 0.00 | 0.70 | 14.75 | 243.39 | -7.76 | 36.91 | 0.2184 | 1011.0 | 773.6 | |
| 0.00 | 1.56 | 0.00 | 0.79 | 13.48 | 243.09 | -8.05 | 41.88 | 0.2050 | 1025.0 | 663.0 | |
| 3.56 | 4.34 | 1.80 | 2.20 | 14.24 | 243.04 | -8.11 | 39.66 | 0.2153 | 1037.8 | 844.3 | |
| 0.00 | 1.65 | 0.00 | 0.84 | 16.41 | 242.73 | -8.42 | 34.75 | 0.2475 | 1103.0 | 895.1 | |
| 1.39 | 37.93 | 0.71 | 19.28 | 14.44 | 242.69 | -8.46 | 40.20 | 0.2218 | 755.3 | -243.5 | |
| 0.00 | 1.13 | 0.00 | 0.57 | 15.38 | 242.62 | -8.53 | 37.75 | 0.2347 | -900.0 | -711.5 | |
| 12.06 | -16.00 | 6.13 | -16.00 | 14.47 | 242.28 | -8.87 | 41.43 | 0.2266 | -1124.8 | 999999 | |
| 1.74 | 2.69 | 0.88 | 1.37 | 14.46 | 241.72 | -9.43 | 43.16 | 0.2329 | -729.7 | -453.5 | |
| 0.00 | 0.87 | 0.00 | 0.44 | 14.91 | 241.33 | -9.82 | 42.98 | 0.2429 | 745.0 | 531.3 | |
| 0.00 | 2.08 | 0.00 | 1.06 | 14.15 | 241.20 | -9.94 | 45.61 | 0.2354 | 1147.0 | 817.7 | |
| 0.00 | 1.04 | 0.00 | 0.53 | 14.27 | 240.95 | -10.20 | 45.95 | 0.2398 | 1008.0 | 792.2 | |
| 1.22 | 2.52 | 0.62 | 1.29 | 14.53 | 240.44 | -10.71 | 46.51 | 0.2491 | 836.4 | 474.3 | |
| 0.00 | 1.22 | 0.00 | 0.62 | 15.83 | 240.12 | -11.03 | 43.64 | 0.2680 | 998.0 | 816.2 | |
| 3.73 | 18.23 | 1.92 | 9.34 | 15.22 | 239.93 | -11.22 | 45.78 | 0.2631 | 1045.2 | 917.2 | |
| 0.00 | 0.95 | 0.00 | 0.49 | 15.86 | 239.83 | -11.32 | 44.28 | 0.2716 | 864.0 | 765.9 | |
| 0.00 | 1.30 | 0.00 | 0.67 | 15.64 | 239.81 | -11.34 | 44.90 | 0.2694 | 952.0 | 654.2 | |
| 0.00 | 1.22 | 0.00 | 0.63 | 15.94 | 239.61 | -11.54 | 44.60 | 0.2753 | 876.0 | 658.6 | |
| Proj. U | - Projected umbra area in millionths of solar disc, negative values indicate | |
|
that the umbra consists of fragmented regions which cannot be separated without losing umbral area. In this way several spots (intensity minima in the umbra) have a common umbra, e.g. -2 means that the given spot shares an umbra with spot No.2, and the common U value is indicated at spot No.2. |
||
| Proj. WS | - Projected whole spot area in millionths of solar disc, negative values indicate | |
|
that several umbras have a common penumbra, e.g. -7 means that the given umbra shares a penumbra with umbra No.7, and the WS value is indicated at No.7. |
||
| Corr. U | - Corrected umbra area in millionths of solar hemisphere, for negative values see above | |
| Corr. WS | - Corrected whole spot area in millionths of solar hemisphere, for negative values see above | |
| B | - Heliographic latitude B; positive: North, negative: South | |
| L | - Heliographic longitude L | |
| LCM | - Longitudinal distance from the Sun's central meridian | |
| Pos. angle | - Position angle | |
| r | - Distance from the centre of Sun's disc in terms of Sun's radius | |
| MU | - Mean magnetic field within the umbra contour averaged the pixel values with sign. | |
| MP | - Mean magnetic field within the penumbra contour averaged the pixel values with sign. | |