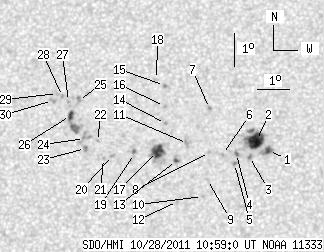
SDO HMI 2011-10-28 10:59:00 UT
See sunspots with tool (Click here to study sunspot positions and configurations with tool using white-light and magnetogram images and polarity drawing)
(It is recommended to set high resolution on your display!)
| group | Proj. U | Proj. WS | Corr. U | Corr. WS | B | L | LCM | Pos. angle | r | MU | MP |
| 36.43 | 119.44 | 18.37 | 60.38 | 14.82 | 242.93 | -5.48 | 26.85 | 0.2014 | -172.6 | 103.0 | |
|
previous
or next observation for the same group /
back to the solar disc SDO HMI 2011-10-28 10:59:00 UT
See sunspots with tool (Click here to study sunspot positions and configurations with tool using white-light and magnetogram images and polarity drawing) (It is recommended to set high resolution on your display!) |
| spot | Proj. U | Proj. WS | Corr. U | Corr. WS | B | L | LCM | Pos. angle | r | MU | MP |
| 3.12 | 6.77 | 1.57 | 3.40 | 14.48 | 245.99 | -2.43 | 13.65 | 0.1747 | -1045.5 | -784.3 | |
| 17.52 | 28.54 | 8.82 | 14.37 | 14.79 | 245.61 | -2.80 | 15.19 | 0.1813 | -1103.5 | -638.7 | |
| 0.00 | 1.82 | 0.00 | 0.92 | 14.30 | 245.40 | -3.01 | 17.07 | 0.1743 | -1019.0 | -880.5 | |
| 0.35 | 2.00 | 0.17 | 1.00 | 14.39 | 245.00 | -3.41 | 19.01 | 0.1779 | -1047.2 | -863.1 | |
| 0.00 | 1.56 | 0.00 | 0.79 | 14.09 | 244.94 | -3.47 | 19.90 | 0.1734 | -1033.0 | -835.2 | |
| 0.00 | 1.13 | 0.00 | 0.57 | 14.36 | 244.57 | -3.84 | 21.26 | 0.1800 | -869.0 | -670.2 | |
| 0.00 | 0.95 | 0.00 | 0.48 | 15.75 | 244.14 | -4.27 | 20.60 | 0.2048 | -883.0 | -778.2 | |
| 0.00 | 1.04 | 0.00 | 0.52 | 14.42 | 244.17 | -4.25 | 23.12 | 0.1835 | -773.0 | -641.5 | |
| 0.00 | 0.69 | 0.00 | 0.35 | 13.60 | 244.12 | -4.29 | 25.30 | 0.1711 | 777.0 | 560.2 | |
| 0.00 | 0.87 | 0.00 | 0.44 | 13.09 | 243.98 | -4.44 | 27.44 | 0.1643 | 692.0 | 526.3 | |
| 0.00 | 3.47 | 0.00 | 1.75 | 14.68 | 243.48 | -4.93 | 25.72 | 0.1925 | 1018.0 | 758.8 | |
| 0.00 | 1.21 | 0.00 | 0.61 | 12.93 | 243.21 | -5.20 | 31.80 | 0.1684 | 756.0 | 565.6 | |
| 1.65 | 3.38 | 0.83 | 1.71 | 14.17 | 243.16 | -5.26 | 28.48 | 0.1872 | 885.6 | 689.5 | |
| 0.00 | 1.13 | 0.00 | 0.57 | 15.28 | 242.79 | -5.63 | 27.33 | 0.2070 | -849.0 | -679.8 | |
| 0.00 | 1.39 | 0.00 | 0.71 | 16.44 | 242.72 | -5.69 | 25.13 | 0.2250 | 943.0 | 833.1 | |
| 0.00 | 1.39 | 0.00 | 0.70 | 15.80 | 242.74 | -5.67 | 26.37 | 0.2151 | 866.0 | 702.6 | |
| 10.32 | 21.77 | 5.21 | 10.99 | 14.43 | 242.56 | -5.85 | 30.37 | 0.1962 | -1052.5 | -474.0 | |
| 0.00 | 1.39 | 0.00 | 0.71 | 16.62 | 242.47 | -5.95 | 25.74 | 0.2296 | 811.0 | 534.2 | |
| 0.00 | 3.21 | 0.00 | 1.62 | 14.37 | 241.85 | -6.56 | 33.47 | 0.2017 | -268.0 | -295.9 | |
| 0.00 | 2.08 | 0.00 | 1.05 | 14.30 | 241.18 | -7.24 | 36.27 | 0.2074 | 1025.0 | 782.5 | |
| 0.00 | 1.13 | 0.00 | 0.57 | 14.21 | 240.90 | -7.52 | 37.57 | 0.2089 | 679.0 | 415.2 | |
| 0.00 | 0.95 | 0.00 | 0.48 | 14.72 | 240.70 | -7.72 | 36.80 | 0.2179 | 487.0 | 545.8 | |
| 0.00 | 2.43 | 0.00 | 1.23 | 14.50 | 240.33 | -8.08 | 38.68 | 0.2188 | 929.0 | 811.4 | |
| 0.00 | 7.03 | 0.00 | 3.57 | 14.80 | 240.29 | -8.13 | 37.95 | 0.2233 | 723.0 | 557.3 | |
| 0.00 | 3.38 | 0.00 | 1.73 | 15.95 | 240.06 | -8.36 | 35.64 | 0.2410 | 950.0 | 824.7 | |
| 3.47 | 12.58 | 1.77 | 6.40 | 15.50 | 239.82 | -8.59 | 37.56 | 0.2372 | 942.4 | 876.6 | |
| 0.00 | 0.78 | 0.00 | 0.40 | 15.92 | 239.74 | -8.67 | 36.71 | 0.2437 | 879.0 | 780.2 | |
| 0.00 | 1.21 | 0.00 | 0.62 | 16.07 | 239.55 | -8.87 | 36.93 | 0.2477 | 839.0 | 703.9 | |
| 0.00 | 1.47 | 0.00 | 0.75 | 16.16 | 239.39 | -9.03 | 37.19 | 0.2505 | 760.0 | 626.6 | |
| 0.00 | 2.69 | 0.00 | 1.37 | 15.94 | 239.24 | -9.17 | 38.17 | 0.2492 | 752.0 | 730.3 | |
| Proj. U | - Projected umbra area in millionths of solar disc, negative values indicate | |
|
that the umbra consists of fragmented regions which cannot be separated without losing umbral area. In this way several spots (intensity minima in the umbra) have a common umbra, e.g. -2 means that the given spot shares an umbra with spot No.2, and the common U value is indicated at spot No.2. |
||
| Proj. WS | - Projected whole spot area in millionths of solar disc, negative values indicate | |
|
that several umbras have a common penumbra, e.g. -7 means that the given umbra shares a penumbra with umbra No.7, and the WS value is indicated at No.7. |
||
| Corr. U | - Corrected umbra area in millionths of solar hemisphere, for negative values see above | |
| Corr. WS | - Corrected whole spot area in millionths of solar hemisphere, for negative values see above | |
| B | - Heliographic latitude B; positive: North, negative: South | |
| L | - Heliographic longitude L | |
| LCM | - Longitudinal distance from the Sun's central meridian | |
| Pos. angle | - Position angle | |
| r | - Distance from the centre of Sun's disc in terms of Sun's radius | |
| MU | - Mean magnetic field within the umbra contour averaged the pixel values with sign. | |
| MP | - Mean magnetic field within the penumbra contour averaged the pixel values with sign. | |