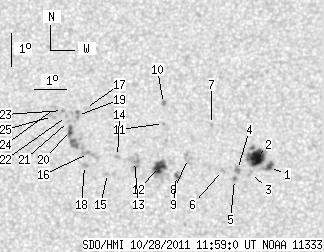
SDO HMI 2011-10-28 11:59:00 UT
See sunspots with tool (Click here to study sunspot positions and configurations with tool using white-light and magnetogram images and polarity drawing)
(It is recommended to set high resolution on your display!)
| group | Proj. U | Proj. WS | Corr. U | Corr. WS | B | L | LCM | Pos. angle | r | MU | MP |
| 36.09 | 126.53 | 18.20 | 63.95 | 14.88 | 242.83 | -5.03 | 24.76 | 0.1989 | -213.0 | 100.9 | |
|
previous
or next observation for the same group /
back to the solar disc SDO HMI 2011-10-28 11:59:00 UT
See sunspots with tool (Click here to study sunspot positions and configurations with tool using white-light and magnetogram images and polarity drawing) (It is recommended to set high resolution on your display!) |
| spot | Proj. U | Proj. WS | Corr. U | Corr. WS | B | L | LCM | Pos. angle | r | MU | MP |
| 3.21 | 5.38 | 1.61 | 2.70 | 14.45 | 246.02 | -1.85 | 10.49 | 0.1722 | -1031.1 | -802.8 | |
| 18.91 | 26.89 | 9.52 | 13.54 | 14.75 | 245.62 | -2.25 | 12.33 | 0.1786 | -1064.5 | -655.5 | |
| 0.00 | 2.34 | 0.00 | 1.18 | 14.27 | 245.44 | -2.43 | 13.95 | 0.1712 | -1007.0 | -746.6 | |
| 0.00 | 4.42 | 0.00 | 2.23 | 14.39 | 245.04 | -2.83 | 15.94 | 0.1750 | -1013.0 | -732.0 | |
| 0.00 | 1.99 | 0.00 | 1.00 | 14.09 | 244.95 | -2.92 | 16.93 | 0.1704 | -1063.0 | -837.7 | |
| 0.00 | 1.99 | 0.00 | 1.00 | 14.36 | 244.58 | -3.29 | 18.43 | 0.1768 | -772.0 | -635.7 | |
| 0.00 | 1.39 | 0.00 | 0.70 | 15.75 | 244.21 | -3.65 | 17.82 | 0.2014 | -905.0 | -654.8 | |
| 0.00 | 6.85 | 0.00 | 3.46 | 14.71 | 243.52 | -4.35 | 22.94 | 0.1889 | 798.0 | 649.2 | |
| 0.87 | 2.95 | 0.44 | 1.49 | 14.20 | 243.16 | -4.71 | 25.82 | 0.1834 | 988.7 | 754.3 | |
| 0.00 | 2.08 | 0.00 | 1.06 | 16.38 | 242.71 | -5.16 | 23.15 | 0.2204 | 999.0 | 820.0 | |
| 0.00 | 1.13 | 0.00 | 0.57 | 15.77 | 242.72 | -5.14 | 24.27 | 0.2109 | 851.0 | 682.2 | |
| 10.06 | 20.12 | 5.08 | 10.15 | 14.47 | 242.63 | -5.24 | 27.60 | 0.1916 | -1016.7 | -463.1 | |
| 0.00 | 11.02 | 0.00 | 5.57 | 14.61 | 241.86 | -6.01 | 30.56 | 0.2002 | -674.0 | -423.1 | |
| 0.00 | 1.30 | 0.00 | 0.66 | 14.76 | 241.33 | -6.54 | 32.31 | 0.2071 | 550.0 | 415.7 | |
| 0.00 | 1.21 | 0.00 | 0.61 | 14.24 | 241.03 | -6.84 | 34.90 | 0.2026 | 608.0 | 497.8 | |
| 0.00 | 7.89 | 0.00 | 4.00 | 14.84 | 240.42 | -7.44 | 35.47 | 0.2168 | 812.0 | 713.1 | |
| 0.00 | 1.04 | 0.00 | 0.53 | 16.20 | 240.28 | -7.59 | 32.49 | 0.2372 | 785.0 | 655.2 | |
| 0.00 | 2.95 | 0.00 | 1.49 | 14.48 | 240.31 | -7.56 | 36.91 | 0.2130 | 772.0 | 719.8 | |
| 0.00 | 3.38 | 0.00 | 1.72 | 15.99 | 240.04 | -7.83 | 33.82 | 0.2364 | 936.0 | 807.6 | |
| 3.04 | 11.45 | 1.55 | 5.82 | 15.53 | 239.84 | -8.03 | 35.64 | 0.2321 | 955.7 | 890.7 | |
| 0.00 | 1.13 | 0.00 | 0.57 | 15.80 | 239.76 | -8.10 | 35.18 | 0.2365 | 927.0 | 702.1 | |
| 0.00 | 0.95 | 0.00 | 0.49 | 15.95 | 239.70 | -8.17 | 35.03 | 0.2392 | 957.0 | 772.2 | |
| 0.00 | 1.56 | 0.00 | 0.80 | 16.13 | 239.56 | -8.31 | 35.01 | 0.2430 | 867.0 | 720.9 | |
| 0.00 | 2.69 | 0.00 | 1.37 | 16.19 | 239.31 | -8.56 | 35.66 | 0.2463 | 576.0 | 603.5 | |
| 0.00 | 2.43 | 0.00 | 1.24 | 15.95 | 239.26 | -8.61 | 36.44 | 0.2435 | 701.0 | 600.7 | |
| Proj. U | - Projected umbra area in millionths of solar disc, negative values indicate | |
|
that the umbra consists of fragmented regions which cannot be separated without losing umbral area. In this way several spots (intensity minima in the umbra) have a common umbra, e.g. -2 means that the given spot shares an umbra with spot No.2, and the common U value is indicated at spot No.2. |
||
| Proj. WS | - Projected whole spot area in millionths of solar disc, negative values indicate | |
|
that several umbras have a common penumbra, e.g. -7 means that the given umbra shares a penumbra with umbra No.7, and the WS value is indicated at No.7. |
||
| Corr. U | - Corrected umbra area in millionths of solar hemisphere, for negative values see above | |
| Corr. WS | - Corrected whole spot area in millionths of solar hemisphere, for negative values see above | |
| B | - Heliographic latitude B; positive: North, negative: South | |
| L | - Heliographic longitude L | |
| LCM | - Longitudinal distance from the Sun's central meridian | |
| Pos. angle | - Position angle | |
| r | - Distance from the centre of Sun's disc in terms of Sun's radius | |
| MU | - Mean magnetic field within the umbra contour averaged the pixel values with sign. | |
| MP | - Mean magnetic field within the penumbra contour averaged the pixel values with sign. | |