SDO HMI 2011-11-16 01:58:58 UT
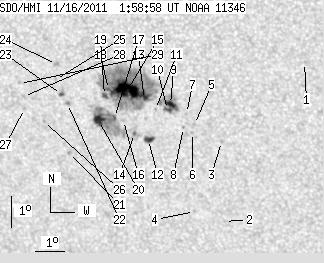
See sunspots with tool (Click here to study sunspot positions and configurations with tool using white-light and magnetogram images and polarity drawing)
(It is recommended to set high resolution on your display!)
| group | Proj. U | Proj. WS | Corr. U | Corr. WS | B | L | LCM | Pos. angle | r | MU | MP |
| 50.81 | 284.94 | 29.44 | 164.94 | -18.15 | 339.25 | -23.57 | 132.95 | 0.5212 | 613.5 | 386.7 | |
|
previous
or next observation for the same group /
back to the solar disc SDO HMI 2011-11-16 01:58:58 UT
See sunspots with tool (Click here to study sunspot positions and configurations with tool using white-light and magnetogram images and polarity drawing) (It is recommended to set high resolution on your display!) |
| spot | Proj. U | Proj. WS | Corr. U | Corr. WS | B | L | LCM | Pos. angle | r | MU | MP |
| 0.00 | 0.86 | 0.00 | 0.47 | -16.84 | 345.44 | -17.38 | 139.40 | 0.4413 | 675.0 | 577.5 | |
| 0.00 | 0.60 | 0.00 | 0.35 | -21.98 | 342.14 | -20.68 | 141.79 | 0.5315 | 543.0 | 361.9 | |
| 0.00 | 1.38 | 0.00 | 0.79 | -19.39 | 342.41 | -20.41 | 138.71 | 0.5005 | 707.0 | 478.8 | |
| 0.00 | 0.86 | 0.00 | 0.50 | -21.68 | 341.16 | -21.66 | 140.14 | 0.5373 | 592.0 | 448.6 | |
| 0.00 | 0.77 | 0.00 | 0.44 | -18.87 | 341.57 | -21.25 | 136.84 | 0.5034 | 560.0 | 423.0 | |
| 0.00 | 1.03 | 0.00 | 0.59 | -19.12 | 341.47 | -21.35 | 137.08 | 0.5072 | 609.0 | 575.2 | |
| 0.00 | 0.86 | 0.00 | 0.49 | -18.52 | 341.35 | -21.47 | 136.05 | 0.5022 | 680.0 | 562.2 | |
| 0.00 | 0.77 | 0.00 | 0.44 | -18.97 | 341.19 | -21.63 | 136.49 | 0.5085 | 835.0 | 674.7 | |
| 4.47 | 22.18 | 2.56 | 12.70 | -18.24 | 340.85 | -21.97 | 135.00 | 0.5046 | 1072.7 | 735.1 | |
| 1.98 | -9.00 | 1.13 | -9.00 | -18.40 | 340.72 | -22.10 | 135.09 | 0.5076 | 820.9 | 999999 | |
| 0.00 | 0.95 | 0.00 | 0.54 | -18.41 | 340.32 | -22.50 | 134.59 | 0.5120 | 612.0 | 455.8 | |
| 4.56 | 5.76 | 2.65 | 3.35 | -19.38 | 339.94 | -22.88 | 135.52 | 0.5256 | 789.7 | 606.1 | |
| 0.86 | 175.60 | 0.50 | 101.29 | -18.10 | 339.99 | -22.83 | 133.73 | 0.5125 | 769.1 | 521.4 | |
| 1.20 | 2.58 | 0.70 | 1.50 | -19.19 | 339.49 | -23.33 | 134.72 | 0.5285 | 654.6 | 497.1 | |
| 22.43 | -13.00 | 12.95 | -13.00 | -17.79 | 339.45 | -23.37 | 132.63 | 0.5154 | 1309.5 | 999999 | |
| 0.00 | 1.89 | 0.00 | 1.10 | -18.78 | 339.17 | -23.65 | 133.77 | 0.5279 | -98.0 | -119.0 | |
| 1.98 | 53.98 | 1.15 | 31.58 | -18.70 | 338.88 | -23.94 | 133.29 | 0.5302 | 548.3 | -107.9 | |
| 1.12 | -13.00 | 0.65 | -13.00 | -17.81 | 338.81 | -24.02 | 131.90 | 0.5227 | 580.9 | 999999 | |
| 2.84 | -13.00 | 1.65 | -13.00 | -18.00 | 338.64 | -24.18 | 132.00 | 0.5263 | 596.1 | 999999 | |
| 7.91 | -17.00 | 4.64 | -17.00 | -18.80 | 338.31 | -24.51 | 132.81 | 0.5374 | -903.2 | 999999 | |
| 0.00 | 1.38 | 0.00 | 0.82 | -19.85 | 337.13 | -25.69 | 133.01 | 0.5597 | 826.0 | 608.4 | |
| 0.00 | 2.06 | 0.00 | 1.22 | -18.28 | 337.32 | -25.50 | 130.97 | 0.5435 | -745.0 | -593.1 | |
| 1.46 | 3.78 | 0.86 | 2.23 | -18.00 | 337.16 | -25.66 | 130.38 | 0.5428 | -888.5 | -528.1 | |
| 0.00 | 1.98 | 0.00 | 1.16 | -17.05 | 337.13 | -25.69 | 128.93 | 0.5348 | 839.0 | 691.7 | |
| 0.00 | 1.12 | 0.00 | 0.66 | -17.53 | 337.03 | -25.79 | 129.54 | 0.5402 | 736.0 | 459.8 | |
| 0.00 | 0.77 | 0.00 | 0.46 | -18.88 | 336.39 | -26.43 | 130.86 | 0.5590 | -804.0 | -623.1 | |
| 0.00 | 1.12 | 0.00 | 0.67 | -18.48 | 335.79 | -27.03 | 129.68 | 0.5622 | 533.0 | 390.8 | |
| 0.00 | 1.80 | 0.00 | 1.08 | -18.10 | 335.82 | -27.00 | 129.15 | 0.5586 | 665.0 | 487.6 | |
| 0.00 | 0.86 | 0.00 | 0.51 | -17.69 | 335.75 | -27.07 | 128.48 | 0.5560 | 582.0 | 486.8 | |
| Proj. U | - Projected umbra area in millionths of solar disc, negative values indicate | |
|
that the umbra consists of fragmented regions which cannot be separated without losing umbral area. In this way several spots (intensity minima in the umbra) have a common umbra, e.g. -2 means that the given spot shares an umbra with spot No.2, and the common U value is indicated at spot No.2. |
||
| Proj. WS | - Projected whole spot area in millionths of solar disc, negative values indicate | |
|
that several umbras have a common penumbra, e.g. -7 means that the given umbra shares a penumbra with umbra No.7, and the WS value is indicated at No.7. |
||
| Corr. U | - Corrected umbra area in millionths of solar hemisphere, for negative values see above | |
| Corr. WS | - Corrected whole spot area in millionths of solar hemisphere, for negative values see above | |
| B | - Heliographic latitude B; positive: North, negative: South | |
| L | - Heliographic longitude L | |
| LCM | - Longitudinal distance from the Sun's central meridian | |
| Pos. angle | - Position angle | |
| r | - Distance from the centre of Sun's disc in terms of Sun's radius | |
| MU | - Mean magnetic field within the umbra contour averaged the pixel values with sign. | |
| MP | - Mean magnetic field within the penumbra contour averaged the pixel values with sign. | |