SDO HMI 2011-11-16 04:58:58 UT
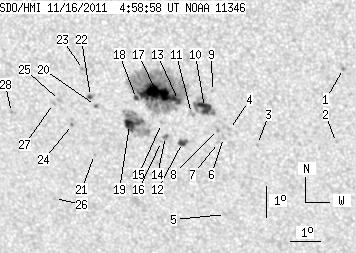
See sunspots with tool (Click here to study sunspot positions and configurations with tool using white-light and magnetogram images and polarity drawing)
(It is recommended to set high resolution on your display!)
| group | Proj. U | Proj. WS | Corr. U | Corr. WS | B | L | LCM | Pos. angle | r | MU | MP |
| 55.61 | 284.97 | 31.78 | 162.80 | -18.15 | 339.41 | -21.77 | 135.12 | 0.5014 | 703.3 | 386.4 | |
|
previous
or next observation for the same group /
back to the solar disc SDO HMI 2011-11-16 04:58:58 UT
See sunspots with tool (Click here to study sunspot positions and configurations with tool using white-light and magnetogram images and polarity drawing) (It is recommended to set high resolution on your display!) |
| spot | Proj. U | Proj. WS | Corr. U | Corr. WS | B | L | LCM | Pos. angle | r | MU | MP |
| 0.00 | 1.29 | 0.00 | 0.70 | -16.93 | 345.66 | -15.52 | 142.63 | 0.4235 | 862.0 | 731.3 | |
| 0.00 | 0.86 | 0.00 | 0.48 | -19.28 | 345.21 | -15.97 | 145.19 | 0.4568 | 763.0 | 621.0 | |
| 0.00 | 0.86 | 0.00 | 0.49 | -19.39 | 342.60 | -18.58 | 141.25 | 0.4822 | 732.0 | 601.7 | |
| 0.00 | 1.55 | 0.00 | 0.88 | -18.92 | 341.72 | -19.45 | 139.34 | 0.4855 | 752.0 | 471.4 | |
| 0.00 | 1.38 | 0.00 | 0.80 | -21.67 | 341.22 | -19.95 | 142.33 | 0.5211 | 351.0 | 319.5 | |
| 0.00 | 1.72 | 0.00 | 0.98 | -19.18 | 341.49 | -19.68 | 139.38 | 0.4907 | 645.0 | 497.5 | |
| 0.00 | 1.20 | 0.00 | 0.68 | -19.34 | 341.30 | -19.87 | 139.35 | 0.4943 | 642.0 | 515.5 | |
| 0.00 | 2.15 | 0.00 | 1.22 | -18.93 | 341.32 | -19.85 | 138.79 | 0.4896 | 785.0 | 496.1 | |
| 0.00 | 0.60 | 0.00 | 0.34 | -17.72 | 341.30 | -19.87 | 136.99 | 0.4767 | -377.0 | -235.3 | |
| 9.46 | 24.50 | 5.35 | 13.86 | -18.23 | 340.98 | -20.20 | 137.30 | 0.4856 | 1021.5 | 707.9 | |
| 0.00 | 3.18 | 0.00 | 1.81 | -18.43 | 340.52 | -20.66 | 136.97 | 0.4925 | 736.0 | 559.0 | |
| 4.30 | 5.42 | 2.47 | 3.11 | -19.37 | 340.09 | -21.08 | 137.74 | 0.5067 | 797.7 | 619.4 | |
| 0.34 | 180.26 | 0.20 | 102.68 | -18.03 | 340.13 | -21.04 | 135.85 | 0.4922 | 992.5 | 491.8 | |
| 0.00 | 2.58 | 0.00 | 1.48 | -19.18 | 339.54 | -21.63 | 136.77 | 0.5104 | 797.0 | 714.2 | |
| 0.00 | 0.86 | 0.00 | 0.49 | -18.77 | 339.47 | -21.71 | 136.08 | 0.5070 | 575.0 | 431.6 | |
| 0.00 | 0.77 | 0.00 | 0.45 | -19.35 | 339.39 | -21.79 | 136.80 | 0.5138 | 415.0 | 402.8 | |
| 31.63 | -13.00 | 18.04 | -13.00 | -17.82 | 339.46 | -21.72 | 134.66 | 0.4973 | 1223.8 | 999999 | |
| 1.81 | -13.00 | 1.04 | -13.00 | -17.99 | 338.73 | -22.45 | 134.00 | 0.5070 | 648.0 | 999999 | |
| 6.10 | 41.43 | 3.53 | 23.93 | -18.82 | 338.37 | -22.80 | 134.80 | 0.5190 | -918.4 | -221.8 | |
| 0.34 | 0.95 | 0.20 | 0.55 | -18.24 | 337.30 | -23.88 | 132.67 | 0.5250 | -708.0 | -650.9 | |
| 0.00 | 1.20 | 0.00 | 0.71 | -19.81 | 337.02 | -24.15 | 134.61 | 0.5429 | 690.0 | 452.0 | |
| 1.63 | 2.92 | 0.95 | 1.70 | -17.96 | 337.17 | -24.01 | 132.10 | 0.5237 | -831.4 | -568.9 | |
| 0.00 | 2.49 | 0.00 | 1.44 | -17.11 | 337.05 | -24.12 | 130.68 | 0.5172 | 806.0 | 718.7 | |
| 0.00 | 1.12 | 0.00 | 0.66 | -18.86 | 336.42 | -24.76 | 132.58 | 0.5404 | -688.0 | -708.8 | |
| 0.00 | 1.89 | 0.00 | 1.11 | -18.11 | 336.08 | -25.09 | 131.12 | 0.5371 | 878.0 | 653.5 | |
| 0.00 | 0.95 | 0.00 | 0.57 | -21.26 | 335.37 | -25.81 | 134.78 | 0.5738 | 631.0 | 483.9 | |
| 0.00 | 1.81 | 0.00 | 1.06 | -18.21 | 335.86 | -25.31 | 131.02 | 0.5405 | 684.0 | 529.3 | |
| 0.00 | 1.03 | 0.00 | 0.62 | -18.53 | 334.35 | -26.83 | 129.92 | 0.5602 | 651.0 | 506.1 | |
| Proj. U | - Projected umbra area in millionths of solar disc, negative values indicate | |
|
that the umbra consists of fragmented regions which cannot be separated without losing umbral area. In this way several spots (intensity minima in the umbra) have a common umbra, e.g. -2 means that the given spot shares an umbra with spot No.2, and the common U value is indicated at spot No.2. |
||
| Proj. WS | - Projected whole spot area in millionths of solar disc, negative values indicate | |
|
that several umbras have a common penumbra, e.g. -7 means that the given umbra shares a penumbra with umbra No.7, and the WS value is indicated at No.7. |
||
| Corr. U | - Corrected umbra area in millionths of solar hemisphere, for negative values see above | |
| Corr. WS | - Corrected whole spot area in millionths of solar hemisphere, for negative values see above | |
| B | - Heliographic latitude B; positive: North, negative: South | |
| L | - Heliographic longitude L | |
| LCM | - Longitudinal distance from the Sun's central meridian | |
| Pos. angle | - Position angle | |
| r | - Distance from the centre of Sun's disc in terms of Sun's radius | |
| MU | - Mean magnetic field within the umbra contour averaged the pixel values with sign. | |
| MP | - Mean magnetic field within the penumbra contour averaged the pixel values with sign. | |