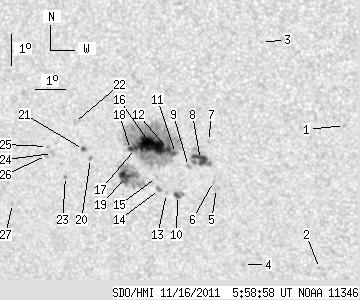
SDO HMI 2011-11-16 05:58:58 UT
See sunspots with tool (Click here to study sunspot positions and configurations with tool using white-light and magnetogram images and polarity drawing)
(It is recommended to set high resolution on your display!)
| group | Proj. U | Proj. WS | Corr. U | Corr. WS | B | L | LCM | Pos. angle | r | MU | MP |
| 58.99 | 265.82 | 33.57 | 151.30 | -18.15 | 339.38 | -21.25 | 135.79 | 0.4959 | 602.2 | 391.6 | |
|
previous
or next observation for the same group /
back to the solar disc SDO HMI 2011-11-16 05:58:58 UT
See sunspots with tool (Click here to study sunspot positions and configurations with tool using white-light and magnetogram images and polarity drawing) (It is recommended to set high resolution on your display!) |
| spot | Proj. U | Proj. WS | Corr. U | Corr. WS | B | L | LCM | Pos. angle | r | MU | MP |
| 0.00 | 1.38 | 0.00 | 0.75 | -17.08 | 345.84 | -14.79 | 144.15 | 0.4184 | 858.0 | 687.2 | |
| 0.00 | 1.29 | 0.00 | 0.73 | -21.68 | 344.58 | -16.05 | 148.03 | 0.4874 | 655.0 | 503.9 | |
| 0.00 | 0.77 | 0.00 | 0.42 | -14.52 | 343.39 | -17.24 | 135.77 | 0.4131 | -710.0 | -523.3 | |
| 0.00 | 1.89 | 0.00 | 1.09 | -21.58 | 342.05 | -18.58 | 144.12 | 0.5077 | 730.0 | 548.5 | |
| 0.00 | 1.98 | 0.00 | 1.12 | -19.14 | 341.46 | -19.17 | 140.04 | 0.4851 | 640.0 | 573.8 | |
| 0.00 | 0.69 | 0.00 | 0.39 | -18.92 | 341.38 | -19.25 | 139.62 | 0.4834 | 731.0 | 652.0 | |
| 0.00 | 0.60 | 0.00 | 0.34 | -17.65 | 341.36 | -19.27 | 137.74 | 0.4695 | -467.0 | -285.9 | |
| 9.03 | 21.32 | 5.09 | 12.01 | -18.23 | 341.03 | -19.60 | 138.12 | 0.4792 | 1023.3 | 733.5 | |
| 0.00 | 2.15 | 0.00 | 1.22 | -18.46 | 340.61 | -20.02 | 137.86 | 0.4861 | 709.0 | 576.7 | |
| 2.84 | 5.33 | 1.62 | 3.05 | -19.39 | 340.12 | -20.51 | 138.53 | 0.5011 | 724.4 | 755.8 | |
| 1.12 | 169.35 | 0.63 | 96.12 | -18.05 | 340.22 | -20.41 | 136.74 | 0.4857 | 915.4 | 489.7 | |
| 1.89 | -11.00 | 1.07 | -11.00 | -17.93 | 340.01 | -20.62 | 136.26 | 0.4867 | 1163.5 | 999999 | |
| 0.00 | 1.03 | 0.00 | 0.59 | -19.33 | 339.76 | -20.87 | 137.97 | 0.5041 | 578.0 | 413.2 | |
| 0.00 | 2.75 | 0.00 | 1.58 | -19.21 | 339.54 | -21.09 | 137.50 | 0.5051 | 785.0 | 639.5 | |
| 0.00 | 0.95 | 0.00 | 0.54 | -18.83 | 339.49 | -21.14 | 136.89 | 0.5015 | 682.0 | 460.7 | |
| 27.77 | -11.00 | 15.77 | -11.00 | -17.81 | 339.45 | -21.18 | 135.34 | 0.4914 | 1274.8 | 999999 | |
| 1.89 | -11.00 | 1.08 | -11.00 | -17.92 | 338.90 | -21.73 | 134.79 | 0.4983 | 745.1 | 999999 | |
| 2.24 | -11.00 | 1.28 | -11.00 | -17.95 | 338.73 | -21.90 | 134.62 | 0.5005 | 671.8 | 999999 | |
| 10.23 | 40.92 | 5.89 | 23.54 | -18.85 | 338.44 | -22.19 | 135.58 | 0.5127 | -834.3 | -176.2 | |
| 0.00 | 1.72 | 0.00 | 0.99 | -18.26 | 337.34 | -23.29 | 133.38 | 0.5187 | -777.0 | -609.3 | |
| 1.98 | 2.24 | 1.14 | 1.29 | -17.98 | 337.14 | -23.49 | 132.73 | 0.5182 | -833.7 | -586.7 | |
| 0.00 | 1.29 | 0.00 | 0.74 | -17.13 | 336.95 | -23.68 | 131.22 | 0.5123 | 749.0 | 583.5 | |
| 0.00 | 1.20 | 0.00 | 0.70 | -18.86 | 336.39 | -24.24 | 133.15 | 0.5346 | -709.0 | -708.4 | |
| 0.00 | 2.41 | 0.00 | 1.41 | -18.13 | 336.06 | -24.57 | 131.71 | 0.5315 | 821.0 | 650.8 | |
| 0.00 | 1.03 | 0.00 | 0.60 | -17.91 | 335.92 | -24.71 | 131.23 | 0.5311 | 682.0 | 608.2 | |
| 0.00 | 2.15 | 0.00 | 1.26 | -18.20 | 335.84 | -24.79 | 131.57 | 0.5346 | 668.0 | 505.2 | |
| 0.00 | 1.38 | 0.00 | 0.82 | -19.76 | 334.40 | -26.23 | 132.28 | 0.5644 | 324.0 | 336.0 | |
| Proj. U | - Projected umbra area in millionths of solar disc, negative values indicate | |
|
that the umbra consists of fragmented regions which cannot be separated without losing umbral area. In this way several spots (intensity minima in the umbra) have a common umbra, e.g. -2 means that the given spot shares an umbra with spot No.2, and the common U value is indicated at spot No.2. |
||
| Proj. WS | - Projected whole spot area in millionths of solar disc, negative values indicate | |
|
that several umbras have a common penumbra, e.g. -7 means that the given umbra shares a penumbra with umbra No.7, and the WS value is indicated at No.7. |
||
| Corr. U | - Corrected umbra area in millionths of solar hemisphere, for negative values see above | |
| Corr. WS | - Corrected whole spot area in millionths of solar hemisphere, for negative values see above | |
| B | - Heliographic latitude B; positive: North, negative: South | |
| L | - Heliographic longitude L | |
| LCM | - Longitudinal distance from the Sun's central meridian | |
| Pos. angle | - Position angle | |
| r | - Distance from the centre of Sun's disc in terms of Sun's radius | |
| MU | - Mean magnetic field within the umbra contour averaged the pixel values with sign. | |
| MP | - Mean magnetic field within the penumbra contour averaged the pixel values with sign. | |