SDO HMI 2011-11-16 08:58:58 UT
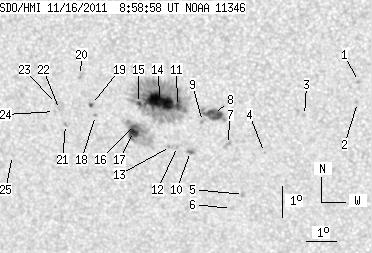
See sunspots with tool (Click here to study sunspot positions and configurations with tool using white-light and magnetogram images and polarity drawing)
(It is recommended to set high resolution on your display!)
| group | Proj. U | Proj. WS | Corr. U | Corr. WS | B | L | LCM | Pos. angle | r | MU | MP |
| 55.87 | 264.73 | 31.41 | 149.02 | -18.11 | 339.46 | -19.53 | 138.06 | 0.4772 | 700.4 | 379.2 | |
|
previous
or next observation for the same group /
back to the solar disc SDO HMI 2011-11-16 08:58:58 UT
See sunspots with tool (Click here to study sunspot positions and configurations with tool using white-light and magnetogram images and polarity drawing) (It is recommended to set high resolution on your display!) |
| spot | Proj. U | Proj. WS | Corr. U | Corr. WS | B | L | LCM | Pos. angle | r | MU | MP |
| 0.00 | 1.55 | 0.00 | 0.84 | -17.08 | 345.96 | -13.03 | 147.45 | 0.4023 | 815.0 | 709.6 | |
| 0.00 | 1.29 | 0.00 | 0.70 | -17.74 | 345.88 | -13.11 | 148.21 | 0.4119 | 772.0 | 576.8 | |
| 0.00 | 1.20 | 0.00 | 0.66 | -18.18 | 344.14 | -14.85 | 145.58 | 0.4326 | 786.0 | 522.5 | |
| 0.00 | 0.86 | 0.00 | 0.48 | -19.38 | 342.73 | -16.26 | 144.80 | 0.4602 | 726.0 | 641.4 | |
| 0.00 | 1.98 | 0.00 | 1.12 | -20.74 | 341.89 | -17.11 | 145.23 | 0.4844 | 845.0 | 628.1 | |
| 0.00 | 1.38 | 0.00 | 0.78 | -21.20 | 341.43 | -17.56 | 145.12 | 0.4939 | 713.0 | 560.1 | |
| 0.00 | 3.78 | 0.00 | 2.12 | -19.14 | 341.54 | -17.45 | 142.58 | 0.4683 | 820.0 | 620.7 | |
| 14.18 | 19.17 | 7.90 | 10.68 | -18.19 | 341.18 | -17.81 | 140.68 | 0.4605 | 968.5 | 731.7 | |
| 0.00 | 1.89 | 0.00 | 1.06 | -18.42 | 340.80 | -18.20 | 140.42 | 0.4670 | 616.0 | 565.5 | |
| 0.69 | 2.06 | 0.39 | 1.17 | -19.38 | 340.29 | -18.70 | 141.03 | 0.4830 | 837.6 | 719.9 | |
| 1.89 | 169.91 | 1.06 | 95.43 | -17.95 | 340.02 | -18.97 | 138.59 | 0.4695 | 1064.9 | 478.2 | |
| 0.00 | 1.38 | 0.00 | 0.78 | -19.23 | 339.88 | -19.12 | 140.22 | 0.4853 | 742.0 | 597.7 | |
| 0.00 | 2.49 | 0.00 | 1.41 | -19.23 | 339.64 | -19.35 | 139.89 | 0.4876 | 567.0 | 557.0 | |
| 26.39 | -11.00 | 14.82 | -11.00 | -17.80 | 339.48 | -19.51 | 137.58 | 0.4735 | 1249.5 | 999999 | |
| 1.38 | -11.00 | 0.78 | -11.00 | -17.88 | 338.74 | -20.25 | 136.66 | 0.4820 | 615.3 | 999999 | |
| 0.60 | 43.75 | 0.34 | 24.88 | -18.55 | 338.56 | -20.43 | 137.41 | 0.4911 | 213.4 | -176.5 | |
| 9.54 | -16.00 | 5.43 | -16.00 | -18.77 | 338.46 | -20.53 | 137.60 | 0.4944 | -821.6 | 999999 | |
| 0.00 | 1.38 | 0.00 | 0.79 | -18.29 | 337.25 | -21.74 | 135.30 | 0.5020 | -711.0 | -553.8 | |
| 1.20 | 2.41 | 0.69 | 1.37 | -17.94 | 337.16 | -21.83 | 134.67 | 0.4994 | -685.6 | -581.6 | |
| 0.00 | 2.15 | 0.00 | 1.22 | -17.03 | 336.91 | -22.08 | 132.96 | 0.4931 | 745.0 | 595.7 | |
| 0.00 | 1.63 | 0.00 | 0.94 | -18.59 | 336.20 | -22.80 | 134.43 | 0.5164 | 643.0 | 472.3 | |
| 0.00 | 1.12 | 0.00 | 0.64 | -18.12 | 336.06 | -22.93 | 133.57 | 0.5132 | 881.0 | 702.3 | |
| 0.00 | 1.20 | 0.00 | 0.69 | -17.93 | 335.98 | -23.01 | 133.20 | 0.5122 | 816.0 | 572.0 | |
| 0.00 | 0.95 | 0.00 | 0.55 | -18.18 | 335.88 | -23.11 | 133.45 | 0.5158 | 661.0 | 527.9 | |
| 0.00 | 1.20 | 0.00 | 0.71 | -19.62 | 334.22 | -24.77 | 133.62 | 0.5474 | 578.0 | 400.6 | |
| Proj. U | - Projected umbra area in millionths of solar disc, negative values indicate | |
|
that the umbra consists of fragmented regions which cannot be separated without losing umbral area. In this way several spots (intensity minima in the umbra) have a common umbra, e.g. -2 means that the given spot shares an umbra with spot No.2, and the common U value is indicated at spot No.2. |
||
| Proj. WS | - Projected whole spot area in millionths of solar disc, negative values indicate | |
|
that several umbras have a common penumbra, e.g. -7 means that the given umbra shares a penumbra with umbra No.7, and the WS value is indicated at No.7. |
||
| Corr. U | - Corrected umbra area in millionths of solar hemisphere, for negative values see above | |
| Corr. WS | - Corrected whole spot area in millionths of solar hemisphere, for negative values see above | |
| B | - Heliographic latitude B; positive: North, negative: South | |
| L | - Heliographic longitude L | |
| LCM | - Longitudinal distance from the Sun's central meridian | |
| Pos. angle | - Position angle | |
| r | - Distance from the centre of Sun's disc in terms of Sun's radius | |
| MU | - Mean magnetic field within the umbra contour averaged the pixel values with sign. | |
| MP | - Mean magnetic field within the penumbra contour averaged the pixel values with sign. | |