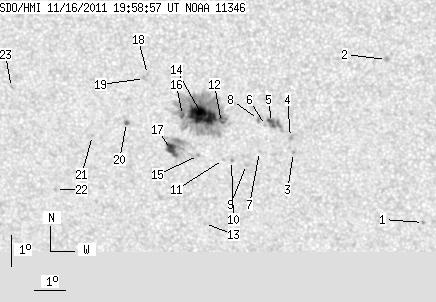
SDO HMI 2011-11-16 19:58:57 UT
See sunspots with tool (Click here to study sunspot positions and configurations with tool using white-light and magnetogram images and polarity drawing)
(It is recommended to set high resolution on your display!)
| group | Proj. U | Proj. WS | Corr. U | Corr. WS | B | L | LCM | Pos. angle | r | MU | MP |
| 49.38 | 228.41 | 26.92 | 124.38 | -18.00 | 339.53 | -13.42 | 147.99 | 0.4177 | 748.6 | 425.0 | |
|
previous
or next observation for the same group /
back to the solar disc SDO HMI 2011-11-16 19:58:57 UT
See sunspots with tool (Click here to study sunspot positions and configurations with tool using white-light and magnetogram images and polarity drawing) (It is recommended to set high resolution on your display!) |
| spot | Proj. U | Proj. WS | Corr. U | Corr. WS | B | L | LCM | Pos. angle | r | MU | MP |
| 0.00 | 1.12 | 0.00 | 0.61 | -21.13 | 346.37 | -6.58 | 165.18 | 0.4195 | 786.0 | 673.2 | |
| 0.00 | 2.40 | 0.00 | 1.27 | -15.95 | 345.42 | -7.53 | 158.48 | 0.3449 | 849.0 | 726.2 | |
| 0.00 | 1.03 | 0.00 | 0.56 | -18.91 | 342.34 | -10.60 | 154.66 | 0.4085 | 919.0 | 785.0 | |
| 0.00 | 2.06 | 0.00 | 1.11 | -18.44 | 342.28 | -10.67 | 153.98 | 0.4021 | 982.0 | 839.3 | |
| 4.81 | 10.65 | 2.60 | 5.75 | -17.97 | 341.70 | -11.24 | 152.22 | 0.3996 | 1082.2 | 934.5 | |
| 0.00 | 1.03 | 0.00 | 0.56 | -18.06 | 341.51 | -11.44 | 151.93 | 0.4025 | 777.0 | 608.2 | |
| 0.00 | 0.69 | 0.00 | 0.37 | -18.89 | 341.26 | -11.69 | 152.43 | 0.4159 | 684.0 | 530.0 | |
| 0.00 | 2.66 | 0.00 | 1.44 | -17.87 | 341.30 | -11.65 | 151.26 | 0.4015 | 949.0 | 772.3 | |
| 0.00 | 1.89 | 0.00 | 1.03 | -19.31 | 340.81 | -12.14 | 152.04 | 0.4250 | 792.0 | 603.5 | |
| 0.00 | 1.20 | 0.00 | 0.66 | -19.19 | 340.34 | -12.61 | 150.99 | 0.4269 | 783.0 | 636.9 | |
| 0.00 | 0.52 | 0.00 | 0.28 | -19.16 | 340.08 | -12.86 | 150.47 | 0.4285 | 668.0 | 500.8 | |
| 1.63 | 160.58 | 0.89 | 87.31 | -17.98 | 340.11 | -12.84 | 149.02 | 0.4124 | 820.8 | 469.6 | |
| 0.00 | 1.20 | 0.00 | 0.67 | -21.23 | 339.29 | -13.66 | 151.43 | 0.4623 | 589.0 | 485.8 | |
| 30.23 | -12.00 | 16.44 | -12.00 | -17.77 | 339.52 | -13.43 | 147.60 | 0.4145 | 1314.5 | 999999 | |
| 0.00 | 1.29 | 0.00 | 0.71 | -19.04 | 339.29 | -13.66 | 148.84 | 0.4332 | 656.0 | 421.8 | |
| 2.15 | -12.00 | 1.17 | -12.00 | -17.77 | 338.88 | -14.07 | 146.40 | 0.4201 | 691.3 | 999999 | |
| 8.93 | 32.12 | 4.92 | 17.65 | -18.86 | 338.43 | -14.52 | 147.06 | 0.4380 | -820.3 | -104.0 | |
| 0.00 | 0.94 | 0.00 | 0.51 | -16.50 | 337.86 | -15.09 | 142.66 | 0.4133 | 863.0 | 612.4 | |
| 0.00 | 2.58 | 0.00 | 1.40 | -16.62 | 337.75 | -15.20 | 142.67 | 0.4159 | 790.0 | 558.0 | |
| 1.63 | 1.80 | 0.90 | 0.99 | -18.02 | 337.05 | -15.90 | 143.50 | 0.4398 | -842.4 | -927.0 | |
| 0.00 | 0.94 | 0.00 | 0.53 | -18.45 | 335.90 | -17.05 | 142.22 | 0.4559 | 755.0 | 562.1 | |
| 0.00 | 0.94 | 0.00 | 0.54 | -20.20 | 334.48 | -18.46 | 142.46 | 0.4898 | 689.0 | 572.0 | |
| 0.00 | 0.77 | 0.00 | 0.43 | -16.97 | 333.40 | -19.54 | 136.23 | 0.4645 | -820.0 | -641.8 | |
| Proj. U | - Projected umbra area in millionths of solar disc, negative values indicate | |
|
that the umbra consists of fragmented regions which cannot be separated without losing umbral area. In this way several spots (intensity minima in the umbra) have a common umbra, e.g. -2 means that the given spot shares an umbra with spot No.2, and the common U value is indicated at spot No.2. |
||
| Proj. WS | - Projected whole spot area in millionths of solar disc, negative values indicate | |
|
that several umbras have a common penumbra, e.g. -7 means that the given umbra shares a penumbra with umbra No.7, and the WS value is indicated at No.7. |
||
| Corr. U | - Corrected umbra area in millionths of solar hemisphere, for negative values see above | |
| Corr. WS | - Corrected whole spot area in millionths of solar hemisphere, for negative values see above | |
| B | - Heliographic latitude B; positive: North, negative: South | |
| L | - Heliographic longitude L | |
| LCM | - Longitudinal distance from the Sun's central meridian | |
| Pos. angle | - Position angle | |
| r | - Distance from the centre of Sun's disc in terms of Sun's radius | |
| MU | - Mean magnetic field within the umbra contour averaged the pixel values with sign. | |
| MP | - Mean magnetic field within the penumbra contour averaged the pixel values with sign. | |