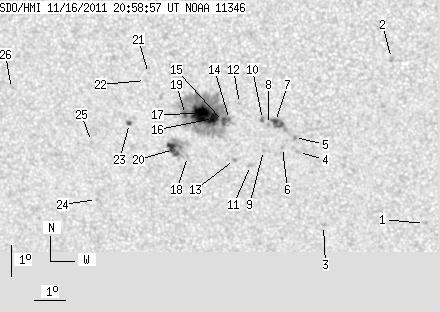
SDO HMI 2011-11-16 20:58:57 UT
See sunspots with tool (Click here to study sunspot positions and configurations with tool using white-light and magnetogram images and polarity drawing)
(It is recommended to set high resolution on your display!)
| group | Proj. U | Proj. WS | Corr. U | Corr. WS | B | L | LCM | Pos. angle | r | MU | MP |
| 44.66 | 222.25 | 24.28 | 120.71 | -18.01 | 339.70 | -12.69 | 149.40 | 0.4120 | 724.2 | 468.2 | |
|
previous
or next observation for the same group /
back to the solar disc SDO HMI 2011-11-16 20:58:57 UT
See sunspots with tool (Click here to study sunspot positions and configurations with tool using white-light and magnetogram images and polarity drawing) (It is recommended to set high resolution on your display!) |
| spot | Proj. U | Proj. WS | Corr. U | Corr. WS | B | L | LCM | Pos. angle | r | MU | MP |
| 0.00 | 1.72 | 0.00 | 0.94 | -21.16 | 346.32 | -6.07 | 166.29 | 0.4179 | 723.0 | 609.0 | |
| 0.00 | 2.49 | 0.00 | 1.31 | -15.92 | 345.49 | -6.91 | 160.06 | 0.3407 | 840.0 | 632.0 | |
| 0.00 | 1.55 | 0.00 | 0.85 | -21.25 | 343.08 | -9.31 | 159.58 | 0.4343 | 736.0 | 628.9 | |
| 0.00 | 1.89 | 0.00 | 1.02 | -18.91 | 342.42 | -9.97 | 155.98 | 0.4041 | 938.0 | 714.6 | |
| 0.00 | 2.15 | 0.00 | 1.16 | -18.43 | 342.33 | -10.07 | 155.25 | 0.3979 | 995.0 | 841.4 | |
| 0.00 | 1.29 | 0.00 | 0.70 | -18.75 | 341.93 | -10.47 | 154.76 | 0.4052 | 907.0 | 696.2 | |
| 2.40 | 11.34 | 1.30 | 6.11 | -17.93 | 341.75 | -10.64 | 153.44 | 0.3946 | 1120.4 | 950.1 | |
| 0.00 | 1.46 | 0.00 | 0.79 | -18.03 | 341.53 | -10.87 | 153.08 | 0.3977 | 785.0 | 629.7 | |
| 0.00 | 1.37 | 0.00 | 0.75 | -18.86 | 341.31 | -11.08 | 153.61 | 0.4109 | 699.0 | 530.6 | |
| 0.52 | 1.80 | 0.28 | 0.97 | -17.87 | 341.35 | -11.05 | 152.51 | 0.3968 | 957.0 | 793.3 | |
| 0.00 | 2.49 | 0.00 | 1.36 | -19.34 | 340.86 | -11.53 | 153.25 | 0.4209 | 778.0 | 524.1 | |
| 0.00 | 1.03 | 0.00 | 0.56 | -17.37 | 340.65 | -11.75 | 150.41 | 0.3952 | 867.0 | 601.8 | |
| 0.00 | 1.80 | 0.00 | 0.98 | -19.15 | 340.36 | -12.03 | 152.06 | 0.4219 | 562.0 | 478.2 | |
| 1.29 | 157.15 | 0.70 | 85.24 | -17.88 | 340.30 | -12.10 | 150.35 | 0.4050 | 861.2 | 515.9 | |
| 3.18 | -14.00 | 1.72 | -14.00 | -17.95 | 340.10 | -12.29 | 150.05 | 0.4074 | 926.7 | 999999 | |
| 6.96 | -14.00 | 3.77 | -14.00 | -17.85 | 339.79 | -12.61 | 149.31 | 0.4087 | 1272.0 | 999999 | |
| 18.12 | -14.00 | 9.83 | -14.00 | -17.70 | 339.38 | -13.01 | 148.31 | 0.4100 | 1337.3 | 999999 | |
| 0.00 | 0.86 | 0.00 | 0.47 | -19.07 | 338.86 | -13.54 | 149.10 | 0.4326 | -164.0 | -127.2 | |
| 2.66 | -14.00 | 1.45 | -14.00 | -17.74 | 338.90 | -13.49 | 147.43 | 0.4146 | 671.6 | 999999 | |
| 7.81 | 25.68 | 4.29 | 14.08 | -18.85 | 338.43 | -13.97 | 148.03 | 0.4333 | -800.7 | -227.4 | |
| 0.00 | 0.77 | 0.00 | 0.42 | -16.46 | 337.82 | -14.58 | 143.54 | 0.4079 | 901.0 | 620.6 | |
| 0.00 | 0.60 | 0.00 | 0.33 | -16.68 | 337.70 | -14.69 | 143.67 | 0.4118 | 836.0 | 578.9 | |
| 1.72 | 2.06 | 0.94 | 1.13 | -18.05 | 337.08 | -15.32 | 144.53 | 0.4347 | -802.6 | -772.5 | |
| 0.00 | 1.20 | 0.00 | 0.68 | -20.49 | 335.75 | -16.64 | 145.60 | 0.4769 | 701.0 | 531.2 | |
| 0.00 | 1.03 | 0.00 | 0.57 | -18.63 | 335.78 | -16.61 | 143.19 | 0.4539 | 602.0 | 576.0 | |
| 0.00 | 0.52 | 0.00 | 0.29 | -16.99 | 333.34 | -19.06 | 136.97 | 0.4595 | -690.0 | -631.7 | |
| Proj. U | - Projected umbra area in millionths of solar disc, negative values indicate | |
|
that the umbra consists of fragmented regions which cannot be separated without losing umbral area. In this way several spots (intensity minima in the umbra) have a common umbra, e.g. -2 means that the given spot shares an umbra with spot No.2, and the common U value is indicated at spot No.2. |
||
| Proj. WS | - Projected whole spot area in millionths of solar disc, negative values indicate | |
|
that several umbras have a common penumbra, e.g. -7 means that the given umbra shares a penumbra with umbra No.7, and the WS value is indicated at No.7. |
||
| Corr. U | - Corrected umbra area in millionths of solar hemisphere, for negative values see above | |
| Corr. WS | - Corrected whole spot area in millionths of solar hemisphere, for negative values see above | |
| B | - Heliographic latitude B; positive: North, negative: South | |
| L | - Heliographic longitude L | |
| LCM | - Longitudinal distance from the Sun's central meridian | |
| Pos. angle | - Position angle | |
| r | - Distance from the centre of Sun's disc in terms of Sun's radius | |
| MU | - Mean magnetic field within the umbra contour averaged the pixel values with sign. | |
| MP | - Mean magnetic field within the penumbra contour averaged the pixel values with sign. | |