SDO HMI 2012-01-03 08:58:55 UT
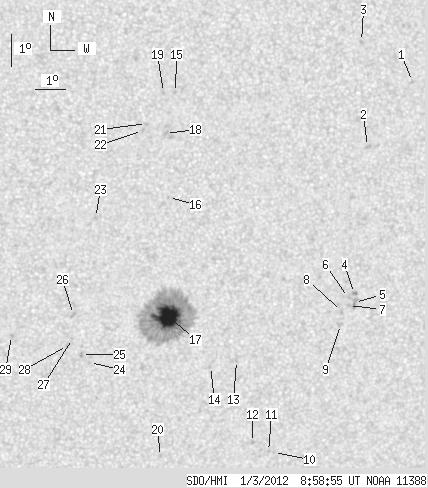
See sunspots with tool (Click here to study sunspot positions and configurations with tool using white-light and magnetogram images and polarity drawing)
(It is recommended to set high resolution on your display!)
| group | Proj. U | Proj. WS | Corr. U | Corr. WS | B | L | LCM | Pos. angle | r | MU | MP |
| 34.66 | 245.92 | 18.96 | 134.62 | -24.29 | 100.65 | 14.12 | 211.63 | 0.4265 | 453.6 | 317.7 | |
|
previous
or next observation for the same group /
back to the solar disc SDO HMI 2012-01-03 08:58:55 UT
See sunspots with tool (Click here to study sunspot positions and configurations with tool using white-light and magnetogram images and polarity drawing) (It is recommended to set high resolution on your display!) |
| spot | Proj. U | Proj. WS | Corr. U | Corr. WS | B | L | LCM | Pos. angle | r | MU | MP |
| 0.00 | 1.36 | 0.00 | 0.74 | -17.13 | 107.53 | 20.99 | 234.55 | 0.4221 | -784.0 | -590.6 | |
| 0.00 | 2.55 | 0.00 | 1.39 | -19.14 | 106.28 | 19.75 | 229.03 | 0.4246 | -845.0 | -686.7 | |
| 0.00 | 1.19 | 0.00 | 0.64 | -15.95 | 105.73 | 19.19 | 234.78 | 0.3886 | -829.0 | -628.9 | |
| 0.00 | 2.04 | 0.00 | 1.15 | -23.71 | 106.49 | 19.96 | 221.53 | 0.4734 | 1021.0 | 823.0 | |
| 0.00 | 3.91 | 0.00 | 2.20 | -23.99 | 106.54 | 20.01 | 221.16 | 0.4769 | 746.0 | 596.4 | |
| 0.00 | 1.19 | 0.00 | 0.67 | -23.84 | 106.31 | 19.78 | 221.09 | 0.4729 | 789.0 | 671.8 | |
| 0.00 | 1.19 | 0.00 | 0.67 | -24.09 | 106.35 | 19.82 | 220.76 | 0.4760 | 862.0 | 691.3 | |
| 0.00 | 1.87 | 0.00 | 1.05 | -24.28 | 106.14 | 19.61 | 220.19 | 0.4760 | 665.0 | 559.8 | |
| 0.00 | 2.29 | 0.00 | 1.29 | -24.69 | 106.17 | 19.64 | 219.62 | 0.4808 | 656.0 | 566.8 | |
| 0.00 | 0.76 | 0.00 | 0.44 | -28.85 | 104.55 | 18.02 | 211.93 | 0.5143 | 386.0 | 389.8 | |
| 0.00 | 1.02 | 0.00 | 0.59 | -28.82 | 104.37 | 17.84 | 211.72 | 0.5125 | 677.0 | 597.6 | |
| 0.00 | 1.19 | 0.00 | 0.68 | -28.53 | 103.76 | 17.22 | 211.20 | 0.5042 | 769.0 | 703.5 | |
| 0.00 | 0.93 | 0.00 | 0.52 | -25.90 | 102.79 | 16.26 | 213.03 | 0.4640 | 769.0 | 607.1 | |
| 0.00 | 1.10 | 0.00 | 0.62 | -26.10 | 101.93 | 15.40 | 211.42 | 0.4594 | 479.0 | 441.9 | |
| 0.00 | 1.10 | 0.00 | 0.58 | -17.59 | 99.90 | 13.37 | 221.47 | 0.3343 | -833.0 | -566.6 | |
| 0.00 | 0.51 | 0.00 | 0.27 | -20.81 | 99.95 | 13.41 | 215.55 | 0.3746 | -687.0 | -491.2 | |
| 34.66 | 204.92 | 18.96 | 112.08 | -24.53 | 100.29 | 13.76 | 210.68 | 0.4258 | 1366.3 | 413.5 | |
| 0.00 | 1.78 | 0.00 | 0.94 | -18.84 | 99.68 | 13.15 | 218.52 | 0.3472 | -852.0 | -715.0 | |
| 0.00 | 1.44 | 0.00 | 0.76 | -17.59 | 99.52 | 12.99 | 220.66 | 0.3302 | -842.0 | -653.1 | |
| 0.00 | 0.76 | 0.00 | 0.43 | -29.04 | 100.62 | 14.08 | 205.97 | 0.4878 | 724.0 | 580.6 | |
| 0.00 | 1.53 | 0.00 | 0.80 | -18.55 | 99.05 | 12.52 | 217.76 | 0.3371 | -812.0 | -739.9 | |
| 0.00 | 1.27 | 0.00 | 0.67 | -18.76 | 98.94 | 12.41 | 217.11 | 0.3387 | -824.0 | -695.9 | |
| 0.00 | 0.93 | 0.00 | 0.50 | -21.46 | 97.64 | 11.11 | 209.75 | 0.3629 | -787.0 | -598.5 | |
| 0.00 | 1.02 | 0.00 | 0.56 | -26.02 | 97.84 | 11.31 | 204.41 | 0.4283 | -719.0 | -571.7 | |
| 0.00 | 1.53 | 0.00 | 0.84 | -25.77 | 97.55 | 11.02 | 204.13 | 0.4228 | -891.0 | -700.8 | |
| 0.00 | 2.29 | 0.00 | 1.24 | -24.50 | 97.17 | 10.64 | 204.79 | 0.4023 | -892.0 | -701.7 | |
| 0.00 | 1.02 | 0.00 | 0.55 | -25.26 | 97.20 | 10.67 | 204.01 | 0.4134 | -826.0 | -635.4 | |
| 0.00 | 1.87 | 0.00 | 1.02 | -25.49 | 97.06 | 10.53 | 203.48 | 0.4156 | -768.0 | -634.1 | |
| 0.00 | 1.36 | 0.00 | 0.73 | -25.19 | 95.18 | 8.65 | 199.97 | 0.4001 | -956.0 | -724.9 | |
| Proj. U | - Projected umbra area in millionths of solar disc, negative values indicate | |
|
that the umbra consists of fragmented regions which cannot be separated without losing umbral area. In this way several spots (intensity minima in the umbra) have a common umbra, e.g. -2 means that the given spot shares an umbra with spot No.2, and the common U value is indicated at spot No.2. |
||
| Proj. WS | - Projected whole spot area in millionths of solar disc, negative values indicate | |
|
that several umbras have a common penumbra, e.g. -7 means that the given umbra shares a penumbra with umbra No.7, and the WS value is indicated at No.7. |
||
| Corr. U | - Corrected umbra area in millionths of solar hemisphere, for negative values see above | |
| Corr. WS | - Corrected whole spot area in millionths of solar hemisphere, for negative values see above | |
| B | - Heliographic latitude B; positive: North, negative: South | |
| L | - Heliographic longitude L | |
| LCM | - Longitudinal distance from the Sun's central meridian | |
| Pos. angle | - Position angle | |
| r | - Distance from the centre of Sun's disc in terms of Sun's radius | |
| MU | - Mean magnetic field within the umbra contour averaged the pixel values with sign. | |
| MP | - Mean magnetic field within the penumbra contour averaged the pixel values with sign. | |