SDO HMI 2012-10-15 01:59:01 UT
See sunspots with tool (Click here to study sunspot positions and configurations with tool using white-light and magnetogram images and polarity drawing)
(It is recommended to set high resolution on your display!)
| group | Proj. U | Proj. WS | Corr. U | Corr. WS | B | L | LCM | Pos. angle | r | MU | MP |
| 105.65 | 524.07 | 74.36 | 368.85 | 7.36 | 228.62 | -45.43 | 85.43 | 0.7106 | -691.3 | -139.4 | |
|
previous
or next observation for the same group /
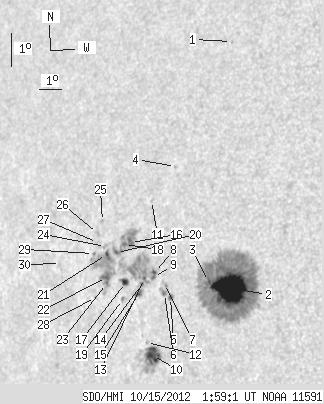
back to the solar disc SDO HMI 2012-10-15 01:59:01 UT
See sunspots with tool (Click here to study sunspot positions and configurations with tool using white-light and magnetogram images and polarity drawing) (It is recommended to set high resolution on your display!) |
| spot | Proj. U | Proj. WS | Corr. U | Corr. WS | B | L | LCM | Pos. angle | r | MU | MP |
| 0.00 | 0.52 | 0.00 | 0.37 | 14.78 | 229.00 | -45.05 | 74.95 | 0.7110 | -625.0 | -505.7 | |
| 57.58 | 321.63 | 39.26 | 219.59 | 7.41 | 230.36 | -43.69 | 85.40 | 0.6895 | -1315.8 | -340.5 | |
| 0.70 | -2.00 | 0.48 | -2.00 | 7.55 | 229.42 | -44.63 | 85.18 | 0.7013 | -454.2 | 999999 | |
| 0.00 | 1.31 | 0.00 | 0.94 | 10.87 | 227.44 | -46.61 | 80.55 | 0.7259 | -418.0 | -332.7 | |
| 2.36 | 2.71 | 1.68 | 1.93 | 6.96 | 227.86 | -46.19 | 85.98 | 0.7205 | -689.8 | -625.8 | |
| 1.66 | 4.11 | 1.19 | 2.94 | 7.06 | 227.58 | -46.47 | 85.83 | 0.7238 | -578.7 | -528.0 | |
| 0.00 | 2.27 | 0.00 | 1.63 | 7.36 | 227.54 | -46.51 | 85.41 | 0.7242 | -679.0 | -616.1 | |
| 1.14 | 55.83 | 0.82 | 40.84 | 7.65 | 227.06 | -46.99 | 84.99 | 0.7299 | -647.9 | 49.8 | |
| 1.31 | -8.00 | 0.95 | -8.00 | 7.50 | 227.03 | -47.01 | 85.20 | 0.7302 | -725.7 | 999999 | |
| 16.78 | 33.55 | 12.08 | 24.20 | 5.17 | 227.26 | -46.79 | 88.41 | 0.7285 | -778.3 | -335.4 | |
| 0.00 | 1.22 | 0.00 | 0.89 | 9.78 | 226.57 | -47.48 | 82.08 | 0.7356 | -384.0 | -339.1 | |
| 0.00 | 0.96 | 0.00 | 0.70 | 5.54 | 226.96 | -47.09 | 87.88 | 0.7318 | -522.0 | -362.5 | |
| 1.31 | -8.00 | 0.95 | -8.00 | 7.44 | 226.64 | -47.41 | 85.27 | 0.7348 | -589.5 | 999999 | |
| 1.40 | -8.00 | 1.02 | -8.00 | 7.25 | 226.53 | -47.52 | 85.53 | 0.7361 | -694.2 | 999999 | |
| 2.80 | 5.16 | 2.04 | 3.77 | 6.97 | 226.44 | -47.61 | 85.90 | 0.7374 | -541.7 | -416.2 | |
| 4.28 | 28.75 | 3.16 | 21.30 | 8.46 | 225.85 | -48.20 | 83.87 | 0.7439 | 803.2 | 635.5 | |
| 3.76 | 4.81 | 2.78 | 3.55 | 7.26 | 225.81 | -48.24 | 85.50 | 0.7446 | -576.5 | -337.9 | |
| 1.75 | -16.00 | 1.30 | -16.00 | 8.38 | 225.59 | -48.46 | 83.98 | 0.7469 | 809.9 | 999999 | |
| 0.00 | 1.57 | 0.00 | 1.16 | 6.74 | 225.74 | -48.31 | 86.19 | 0.7455 | -385.0 | -256.2 | |
| 1.57 | -16.00 | 1.17 | -16.00 | 8.12 | 225.27 | -48.78 | 84.33 | 0.7506 | 760.3 | 999999 | |
| 1.75 | 51.03 | 1.32 | 38.47 | 8.03 | 224.82 | -49.23 | 84.45 | 0.7558 | 910.9 | 405.6 | |
| 4.37 | -21.00 | 3.29 | -21.00 | 7.34 | 224.93 | -49.12 | 85.36 | 0.7547 | 420.5 | 999999 | |
| 0.26 | -21.00 | 0.20 | -21.00 | 7.16 | 224.95 | -49.10 | 85.60 | 0.7545 | -444.0 | 999999 | |
| 0.00 | 1.83 | 0.00 | 1.38 | 8.26 | 224.74 | -49.31 | 84.13 | 0.7567 | 598.0 | 544.6 | |
| 0.00 | 1.66 | 0.00 | 1.26 | 8.99 | 224.47 | -49.58 | 83.16 | 0.7597 | 669.0 | 552.5 | |
| 0.00 | 2.27 | 0.00 | 1.73 | 8.62 | 224.30 | -49.75 | 83.66 | 0.7616 | 649.0 | 488.5 | |
| 0.00 | 1.14 | 0.00 | 0.86 | 8.35 | 224.35 | -49.70 | 84.01 | 0.7611 | 613.0 | 538.8 | |
| 0.00 | 1.22 | 0.00 | 0.93 | 6.71 | 224.51 | -49.54 | 86.18 | 0.7597 | 724.0 | 624.9 | |
| 0.87 | -21.00 | 0.67 | -21.00 | 8.01 | 224.22 | -49.83 | 84.46 | 0.7626 | 684.8 | 999999 | |
| 0.00 | 0.52 | 0.00 | 0.41 | 7.59 | 222.71 | -51.34 | 84.96 | 0.7793 | 462.0 | 354.7 | |
| Proj. U | - Projected umbra area in millionths of solar disc, negative values indicate | |
|
that the umbra consists of fragmented regions which cannot be separated without losing umbral area. In this way several spots (intensity minima in the umbra) have a common umbra, e.g. -2 means that the given spot shares an umbra with spot No.2, and the common U value is indicated at spot No.2. |
||
| Proj. WS | - Projected whole spot area in millionths of solar disc, negative values indicate | |
|
that several umbras have a common penumbra, e.g. -7 means that the given umbra shares a penumbra with umbra No.7, and the WS value is indicated at No.7. |
||
| Corr. U | - Corrected umbra area in millionths of solar hemisphere, for negative values see above | |
| Corr. WS | - Corrected whole spot area in millionths of solar hemisphere, for negative values see above | |
| B | - Heliographic latitude B; positive: North, negative: South | |
| L | - Heliographic longitude L | |
| LCM | - Longitudinal distance from the Sun's central meridian | |
| Pos. angle | - Position angle | |
| r | - Distance from the centre of Sun's disc in terms of Sun's radius | |
| MU | - Mean magnetic field within the umbra contour averaged the pixel values with sign. | |
| MP | - Mean magnetic field within the penumbra contour averaged the pixel values with sign. | |