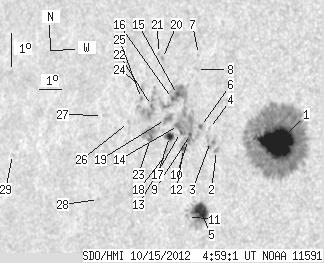
SDO HMI 2012-10-15 04:59:01 UT
See sunspots with tool (Click here to study sunspot positions and configurations with tool using white-light and magnetogram images and polarity drawing)
(It is recommended to set high resolution on your display!)
| group | Proj. U | Proj. WS | Corr. U | Corr. WS | B | L | LCM | Pos. angle | r | MU | MP |
| 92.21 | 559.93 | 62.85 | 383.19 | 7.33 | 228.65 | -43.75 | 85.49 | 0.6900 | -741.3 | -140.0 | |
|
previous
or next observation for the same group /
back to the solar disc SDO HMI 2012-10-15 04:59:01 UT
See sunspots with tool (Click here to study sunspot positions and configurations with tool using white-light and magnetogram images and polarity drawing) (It is recommended to set high resolution on your display!) |
| spot | Proj. U | Proj. WS | Corr. U | Corr. WS | B | L | LCM | Pos. angle | r | MU | MP |
| 54.45 | 342.05 | 36.19 | 227.50 | 7.41 | 230.32 | -42.08 | 85.40 | 0.6691 | -1326.8 | -343.1 | |
| 0.00 | 2.45 | 0.00 | 1.69 | 7.00 | 227.84 | -44.57 | 85.95 | 0.7006 | -831.0 | -705.8 | |
| 0.00 | 8.30 | 0.00 | 5.77 | 7.25 | 227.55 | -44.85 | 85.58 | 0.7041 | -658.0 | -626.0 | |
| 0.00 | 0.87 | 0.00 | 0.61 | 7.63 | 227.46 | -44.95 | 85.03 | 0.7052 | -483.0 | -404.9 | |
| 17.30 | 35.31 | 12.09 | 24.71 | 5.14 | 227.35 | -45.06 | 88.58 | 0.7075 | -844.6 | -265.7 | |
| 1.49 | 120.08 | 1.04 | 85.94 | 7.67 | 227.07 | -45.34 | 84.98 | 0.7100 | -676.7 | 268.9 | |
| 0.00 | 0.87 | 0.00 | 0.62 | 9.80 | 226.65 | -45.76 | 81.98 | 0.7152 | -374.0 | -326.6 | |
| 0.00 | 1.40 | 0.00 | 0.99 | 9.35 | 226.64 | -45.77 | 82.61 | 0.7152 | -466.0 | -381.9 | |
| 1.40 | -6.00 | 0.99 | -6.00 | 7.40 | 226.67 | -45.73 | 85.35 | 0.7148 | -620.9 | 999999 | |
| 1.22 | -6.00 | 0.86 | -6.00 | 7.24 | 226.60 | -45.80 | 85.57 | 0.7157 | -810.8 | 999999 | |
| 0.00 | 1.84 | 0.00 | 1.29 | 4.95 | 226.81 | -45.60 | 88.80 | 0.7143 | 63.0 | -44.8 | |
| 1.92 | -6.00 | 1.36 | -6.00 | 6.96 | 226.42 | -45.98 | 85.96 | 0.7179 | -530.5 | 999999 | |
| 1.40 | -6.00 | 0.99 | -6.00 | 7.43 | 226.23 | -46.17 | 85.30 | 0.7201 | -440.7 | 999999 | |
| 2.80 | -6.00 | 1.99 | -6.00 | 7.63 | 226.12 | -46.29 | 85.02 | 0.7215 | 287.0 | 999999 | |
| 1.57 | -6.00 | 1.12 | -6.00 | 8.55 | 225.94 | -46.47 | 83.74 | 0.7236 | 918.2 | 999999 | |
| 1.40 | -6.00 | 1.00 | -6.00 | 8.41 | 225.74 | -46.67 | 83.93 | 0.7260 | 847.8 | 999999 | |
| 5.16 | 6.38 | 3.70 | 4.58 | 7.27 | 225.77 | -46.64 | 85.51 | 0.7257 | -517.7 | -304.5 | |
| 0.00 | 2.80 | 0.00 | 2.01 | 6.76 | 225.70 | -46.70 | 86.22 | 0.7266 | -105.0 | -221.9 | |
| 0.00 | 11.10 | 0.00 | 7.99 | 7.77 | 225.52 | -46.88 | 84.82 | 0.7285 | 498.0 | 407.4 | |
| 0.00 | 1.57 | 0.00 | 1.14 | 9.57 | 225.10 | -47.31 | 82.34 | 0.7336 | 806.0 | 679.5 | |
| 0.00 | 0.70 | 0.00 | 0.51 | 9.71 | 224.89 | -47.51 | 82.16 | 0.7361 | 520.0 | 445.8 | |
| 0.79 | -6.00 | 0.57 | -6.00 | 8.14 | 224.84 | -47.56 | 84.30 | 0.7365 | 720.6 | 999999 | |
| 1.31 | 15.73 | 0.95 | 11.47 | 7.18 | 224.94 | -47.47 | 85.61 | 0.7356 | -356.7 | 257.1 | |
| 0.00 | 3.76 | 0.00 | 2.77 | 8.64 | 224.35 | -48.05 | 83.61 | 0.7422 | 706.0 | 514.8 | |
| 0.00 | 1.05 | 0.00 | 0.77 | 8.31 | 224.36 | -48.04 | 84.06 | 0.7421 | 685.0 | 585.5 | |
| 0.00 | 1.22 | 0.00 | 0.91 | 7.56 | 223.89 | -48.52 | 85.07 | 0.7477 | 501.0 | 460.9 | |
| 0.00 | 0.52 | 0.00 | 0.40 | 7.67 | 222.67 | -49.74 | 84.88 | 0.7616 | 438.0 | 442.3 | |
| 0.00 | 1.14 | 0.00 | 0.86 | 5.16 | 222.81 | -49.60 | 88.20 | 0.7611 | 652.0 | 519.2 | |
| 0.00 | 0.79 | 0.00 | 0.66 | 6.17 | 218.48 | -53.92 | 86.62 | 0.8072 | 389.0 | 361.7 | |
| Proj. U | - Projected umbra area in millionths of solar disc, negative values indicate | |
|
that the umbra consists of fragmented regions which cannot be separated without losing umbral area. In this way several spots (intensity minima in the umbra) have a common umbra, e.g. -2 means that the given spot shares an umbra with spot No.2, and the common U value is indicated at spot No.2. |
||
| Proj. WS | - Projected whole spot area in millionths of solar disc, negative values indicate | |
|
that several umbras have a common penumbra, e.g. -7 means that the given umbra shares a penumbra with umbra No.7, and the WS value is indicated at No.7. |
||
| Corr. U | - Corrected umbra area in millionths of solar hemisphere, for negative values see above | |
| Corr. WS | - Corrected whole spot area in millionths of solar hemisphere, for negative values see above | |
| B | - Heliographic latitude B; positive: North, negative: South | |
| L | - Heliographic longitude L | |
| LCM | - Longitudinal distance from the Sun's central meridian | |
| Pos. angle | - Position angle | |
| r | - Distance from the centre of Sun's disc in terms of Sun's radius | |
| MU | - Mean magnetic field within the umbra contour averaged the pixel values with sign. | |
| MP | - Mean magnetic field within the penumbra contour averaged the pixel values with sign. | |