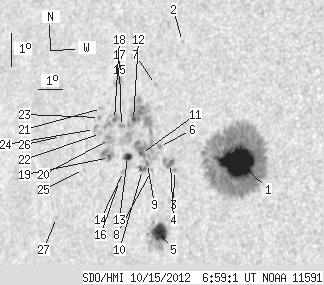
SDO HMI 2012-10-15 06:59:01 UT
See sunspots with tool (Click here to study sunspot positions and configurations with tool using white-light and magnetogram images and polarity drawing)
(It is recommended to set high resolution on your display!)
| group | Proj. U | Proj. WS | Corr. U | Corr. WS | B | L | LCM | Pos. angle | r | MU | MP |
| 96.57 | 582.56 | 64.50 | 391.71 | 7.29 | 228.65 | -42.66 | 85.55 | 0.6762 | -759.1 | -121.5 | |
|
previous
or next observation for the same group /
back to the solar disc SDO HMI 2012-10-15 06:59:01 UT
See sunspots with tool (Click here to study sunspot positions and configurations with tool using white-light and magnetogram images and polarity drawing) (It is recommended to set high resolution on your display!) |
| spot | Proj. U | Proj. WS | Corr. U | Corr. WS | B | L | LCM | Pos. angle | r | MU | MP |
| 60.39 | 351.57 | 39.47 | 230.16 | 7.41 | 230.36 | -40.95 | 85.39 | 0.6544 | -1268.9 | -304.1 | |
| 0.00 | 0.87 | 0.00 | 0.60 | 10.87 | 227.55 | -43.76 | 80.34 | 0.6913 | -580.0 | -461.0 | |
| 0.00 | 2.10 | 0.00 | 1.43 | 7.00 | 227.79 | -43.52 | 85.96 | 0.6875 | -890.0 | -685.9 | |
| 3.76 | 8.83 | 2.56 | 6.03 | 7.20 | 227.60 | -43.71 | 85.67 | 0.6898 | -769.1 | -601.5 | |
| 17.39 | 43.52 | 11.92 | 29.88 | 5.11 | 227.35 | -43.96 | 88.68 | 0.6939 | -867.5 | -331.8 | |
| 0.00 | 2.36 | 0.00 | 1.62 | 7.67 | 227.08 | -44.23 | 84.97 | 0.6963 | -721.0 | -536.6 | |
| 0.00 | 1.14 | 0.00 | 0.79 | 9.51 | 226.64 | -44.67 | 82.35 | 0.7019 | -496.0 | -422.5 | |
| 0.00 | 1.05 | 0.00 | 0.72 | 6.94 | 226.83 | -44.48 | 86.03 | 0.6995 | -706.0 | -460.5 | |
| 1.66 | 106.53 | 1.15 | 74.36 | 7.13 | 226.64 | -44.67 | 85.74 | 0.7019 | -790.6 | 169.7 | |
| 2.88 | -9.00 | 2.01 | -9.00 | 6.94 | 226.45 | -44.86 | 86.01 | 0.7042 | -581.1 | 999999 | |
| 1.49 | -9.00 | 1.04 | -9.00 | 7.41 | 226.35 | -44.96 | 85.34 | 0.7054 | -446.1 | 999999 | |
| 1.92 | -9.00 | 1.35 | -9.00 | 8.40 | 225.87 | -45.44 | 83.93 | 0.7112 | 864.6 | 999999 | |
| 5.07 | 6.64 | 3.57 | 4.67 | 7.28 | 225.76 | -45.55 | 85.51 | 0.7126 | -530.1 | -292.1 | |
| 0.00 | 1.75 | 0.00 | 1.23 | 6.82 | 225.65 | -45.66 | 86.15 | 0.7141 | -328.0 | -270.5 | |
| 0.00 | 4.19 | 0.00 | 2.97 | 8.16 | 225.38 | -45.93 | 84.28 | 0.7171 | 881.0 | 742.5 | |
| 0.00 | 0.96 | 0.00 | 0.68 | 6.54 | 225.51 | -45.80 | 86.54 | 0.7159 | -391.0 | -286.3 | |
| 0.00 | 4.98 | 0.00 | 3.55 | 9.52 | 225.03 | -46.28 | 82.38 | 0.7214 | 679.0 | 651.6 | |
| 0.70 | 11.01 | 0.50 | 7.86 | 8.34 | 225.05 | -46.26 | 84.02 | 0.7211 | 830.9 | 634.7 | |
| 1.31 | 14.77 | 0.93 | 10.55 | 7.20 | 224.99 | -46.32 | 85.61 | 0.7219 | -340.7 | 216.3 | |
| 0.00 | 9.53 | 0.00 | 6.80 | 7.73 | 224.92 | -46.39 | 84.86 | 0.7227 | 420.0 | 428.3 | |
| 0.00 | 2.10 | 0.00 | 1.51 | 8.63 | 224.43 | -46.88 | 83.62 | 0.7285 | 740.0 | 569.2 | |
| 0.00 | 1.40 | 0.00 | 1.01 | 7.88 | 224.50 | -46.81 | 84.65 | 0.7277 | 477.0 | 400.8 | |
| 0.00 | 1.49 | 0.00 | 1.07 | 8.35 | 224.38 | -46.93 | 84.00 | 0.7290 | 706.0 | 603.5 | |
| 0.00 | 2.88 | 0.00 | 2.09 | 7.98 | 224.22 | -47.09 | 84.51 | 0.7310 | 604.0 | 584.7 | |
| 0.00 | 0.79 | 0.00 | 0.57 | 6.76 | 223.90 | -47.41 | 86.18 | 0.7351 | 561.0 | 387.6 | |
| 0.00 | 1.05 | 0.00 | 0.78 | 7.66 | 222.78 | -48.53 | 84.91 | 0.7479 | 562.0 | 366.9 | |
| 0.00 | 1.05 | 0.00 | 0.78 | 5.24 | 222.86 | -48.46 | 88.17 | 0.7480 | 582.0 | 526.2 | |
| Proj. U | - Projected umbra area in millionths of solar disc, negative values indicate | |
|
that the umbra consists of fragmented regions which cannot be separated without losing umbral area. In this way several spots (intensity minima in the umbra) have a common umbra, e.g. -2 means that the given spot shares an umbra with spot No.2, and the common U value is indicated at spot No.2. |
||
| Proj. WS | - Projected whole spot area in millionths of solar disc, negative values indicate | |
|
that several umbras have a common penumbra, e.g. -7 means that the given umbra shares a penumbra with umbra No.7, and the WS value is indicated at No.7. |
||
| Corr. U | - Corrected umbra area in millionths of solar hemisphere, for negative values see above | |
| Corr. WS | - Corrected whole spot area in millionths of solar hemisphere, for negative values see above | |
| B | - Heliographic latitude B; positive: North, negative: South | |
| L | - Heliographic longitude L | |
| LCM | - Longitudinal distance from the Sun's central meridian | |
| Pos. angle | - Position angle | |
| r | - Distance from the centre of Sun's disc in terms of Sun's radius | |
| MU | - Mean magnetic field within the umbra contour averaged the pixel values with sign. | |
| MP | - Mean magnetic field within the penumbra contour averaged the pixel values with sign. | |