SDO HMI 2013-02-21 07:58:57 UT
See sunspots with tool (Click here to study sunspot positions and configurations with tool using white-light and magnetogram images and polarity drawing)
(It is recommended to set high resolution on your display!)
| group | Proj. U | Proj. WS | Corr. U | Corr. WS | B | L | LCM | Pos. angle | r | MU | MP |
| 149.77 | 761.12 | 151.57 | 781.58 | 10.18 | 69.99 | 58.85 | 285.83 | 0.8759 | 22.3 | -12.3 | |
|
previous
or next observation for the same group /
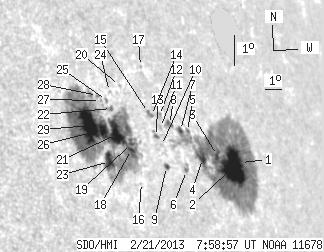
back to the solar disc SDO HMI 2013-02-21 07:58:57 UT
See sunspots with tool (Click here to study sunspot positions and configurations with tool using white-light and magnetogram images and polarity drawing) (It is recommended to set high resolution on your display!) |
| spot | Proj. U | Proj. WS | Corr. U | Corr. WS | B | L | LCM | Pos. angle | r | MU | MP |
| 5.24 | 373.24 | 6.15 | 424.14 | 10.24 | 74.06 | 62.93 | 284.80 | 0.9081 | 261.5 | -218.4 | |
| 44.80 | -1.00 | 51.33 | -1.00 | 10.02 | 73.45 | 62.32 | 284.71 | 0.9034 | -886.9 | 999999 | |
| 3.35 | -1.00 | 3.73 | -1.00 | 10.29 | 72.58 | 61.44 | 285.22 | 0.8975 | -806.1 | 999999 | |
| 5.67 | -1.00 | 6.10 | -1.00 | 10.09 | 71.57 | 60.44 | 285.25 | 0.8896 | -755.2 | 999999 | |
| 0.95 | -1.00 | 1.00 | -1.00 | 10.85 | 70.91 | 59.77 | 286.26 | 0.8859 | -317.7 | 999999 | |
| 0.95 | 2.84 | 0.98 | 2.94 | 9.60 | 70.46 | 59.32 | 285.01 | 0.8799 | -713.2 | -528.6 | |
| 2.32 | -1.00 | 2.43 | -1.00 | 10.83 | 70.48 | 59.34 | 286.36 | 0.8825 | -487.9 | 999999 | |
| 2.49 | 5.42 | 2.56 | 5.55 | 10.95 | 69.87 | 58.73 | 286.66 | 0.8780 | -639.5 | -441.5 | |
| 1.72 | 2.84 | 1.72 | 2.84 | 9.59 | 69.29 | 58.15 | 285.32 | 0.8704 | 204.8 | 124.5 | |
| 0.00 | 1.55 | 0.00 | 1.55 | 10.23 | 69.18 | 58.05 | 286.05 | 0.8709 | -246.0 | -230.8 | |
| 0.00 | 1.63 | 0.00 | 1.65 | 10.80 | 69.30 | 58.16 | 286.65 | 0.8730 | -263.0 | -380.1 | |
| 0.00 | 2.58 | 0.00 | 2.61 | 11.17 | 69.36 | 58.22 | 287.05 | 0.8743 | -450.0 | -437.4 | |
| 1.03 | 2.41 | 1.03 | 2.40 | 10.48 | 68.97 | 57.83 | 286.40 | 0.8697 | 229.0 | 38.0 | |
| 0.34 | 3.27 | 0.34 | 3.25 | 11.12 | 68.88 | 57.75 | 287.13 | 0.8704 | -333.2 | -288.0 | |
| 0.69 | -14.00 | 0.68 | -14.00 | 11.20 | 68.74 | 57.60 | 287.26 | 0.8693 | -583.2 | 999999 | |
| 0.00 | 0.60 | 0.00 | 0.57 | 8.94 | 67.71 | 56.58 | 285.01 | 0.8557 | 265.0 | 208.7 | |
| 0.00 | 0.86 | 0.00 | 0.87 | 12.63 | 68.76 | 57.63 | 288.84 | 0.8728 | 274.0 | 224.0 | |
| 2.41 | 354.16 | 2.29 | 324.12 | 9.92 | 67.42 | 56.28 | 286.21 | 0.8553 | 282.0 | 286.4 | |
| 2.06 | -18.00 | 1.97 | -18.00 | 10.11 | 67.47 | 56.33 | 286.41 | 0.8562 | 211.9 | 999999 | |
| 0.00 | 0.77 | 0.00 | 0.74 | 11.89 | 67.34 | 56.20 | 288.46 | 0.8593 | 326.0 | 239.0 | |
| 19.17 | -18.00 | 17.91 | -18.00 | 10.31 | 66.71 | 55.57 | 286.86 | 0.8501 | 563.4 | 999999 | |
| 0.86 | 4.30 | 0.81 | 4.02 | 11.11 | 66.66 | 55.53 | 287.78 | 0.8516 | 205.5 | 205.9 | |
| 11.95 | -18.00 | 10.93 | -18.00 | 9.41 | 66.11 | 54.97 | 286.02 | 0.8426 | 772.0 | 999999 | |
| 0.00 | 0.77 | 0.00 | 0.73 | 11.64 | 66.71 | 55.58 | 288.37 | 0.8534 | 235.0 | 180.7 | |
| 0.00 | 1.55 | 0.00 | 1.45 | 11.33 | 66.46 | 55.32 | 288.10 | 0.8505 | 249.0 | 222.7 | |
| 8.17 | -18.00 | 7.50 | -18.00 | 10.39 | 66.04 | 54.90 | 287.16 | 0.8444 | 681.4 | 999999 | |
| 0.00 | 0.95 | 0.00 | 0.88 | 11.30 | 66.13 | 55.00 | 288.17 | 0.8475 | 399.0 | 378.8 | |
| 0.00 | 1.38 | 0.00 | 1.27 | 11.44 | 66.01 | 54.88 | 288.37 | 0.8468 | 422.0 | 354.6 | |
| 35.60 | -18.00 | 32.11 | -18.00 | 10.44 | 65.32 | 54.18 | 287.45 | 0.8381 | 1033.2 | 999999 | |
| Proj. U | - Projected umbra area in millionths of solar disc, negative values indicate | |
|
that the umbra consists of fragmented regions which cannot be separated without losing umbral area. In this way several spots (intensity minima in the umbra) have a common umbra, e.g. -2 means that the given spot shares an umbra with spot No.2, and the common U value is indicated at spot No.2. |
||
| Proj. WS | - Projected whole spot area in millionths of solar disc, negative values indicate | |
|
that several umbras have a common penumbra, e.g. -7 means that the given umbra shares a penumbra with umbra No.7, and the WS value is indicated at No.7. |
||
| Corr. U | - Corrected umbra area in millionths of solar hemisphere, for negative values see above | |
| Corr. WS | - Corrected whole spot area in millionths of solar hemisphere, for negative values see above | |
| B | - Heliographic latitude B; positive: North, negative: South | |
| L | - Heliographic longitude L | |
| LCM | - Longitudinal distance from the Sun's central meridian | |
| Pos. angle | - Position angle | |
| r | - Distance from the centre of Sun's disc in terms of Sun's radius | |
| MU | - Mean magnetic field within the umbra contour averaged the pixel values with sign. | |
| MP | - Mean magnetic field within the penumbra contour averaged the pixel values with sign. | |