SDO HMI 2013-02-21 10:58:57 UT
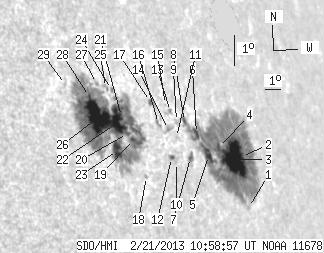
See sunspots with tool (Click here to study sunspot positions and configurations with tool using white-light and magnetogram images and polarity drawing)
(It is recommended to set high resolution on your display!)
| group | Proj. U | Proj. WS | Corr. U | Corr. WS | B | L | LCM | Pos. angle | r | MU | MP |
| 150.38 | 727.23 | 160.44 | 785.16 | 10.16 | 69.86 | 60.36 | 285.41 | 0.8875 | 2.2 | -6.0 | |
|
previous
or next observation for the same group /
back to the solar disc SDO HMI 2013-02-21 10:58:57 UT
See sunspots with tool (Click here to study sunspot positions and configurations with tool using white-light and magnetogram images and polarity drawing) (It is recommended to set high resolution on your display!) |
| spot | Proj. U | Proj. WS | Corr. U | Corr. WS | B | L | LCM | Pos. angle | r | MU | MP |
| 0.00 | 1.98 | 0.00 | 2.43 | 8.58 | 74.03 | 64.54 | 282.65 | 0.9167 | -149.0 | -129.9 | |
| 7.22 | 345.17 | 9.01 | 416.87 | 10.15 | 74.09 | 64.60 | 284.31 | 0.9194 | 341.7 | -187.9 | |
| 43.93 | -2.00 | 53.40 | -2.00 | 9.99 | 73.47 | 63.97 | 284.28 | 0.9149 | -876.2 | 999999 | |
| 2.41 | -2.00 | 2.83 | -2.00 | 10.25 | 72.54 | 63.05 | 284.78 | 0.9090 | -718.4 | 999999 | |
| 7.91 | -2.00 | 9.03 | -2.00 | 9.92 | 71.76 | 62.27 | 284.61 | 0.9029 | -837.8 | 999999 | |
| 3.27 | -2.00 | 3.68 | -2.00 | 10.54 | 71.20 | 61.70 | 285.42 | 0.8998 | -530.3 | 999999 | |
| 2.15 | 4.13 | 2.35 | 4.52 | 9.73 | 70.55 | 61.05 | 284.70 | 0.8936 | -706.1 | -541.5 | |
| 2.15 | -2.00 | 2.37 | -2.00 | 10.83 | 70.54 | 61.05 | 285.91 | 0.8955 | -482.4 | 999999 | |
| 0.00 | 2.67 | 0.00 | 2.89 | 10.78 | 70.02 | 60.53 | 285.98 | 0.8915 | -454.0 | -467.7 | |
| 0.00 | 0.52 | 0.00 | 0.55 | 9.47 | 69.61 | 60.11 | 284.66 | 0.8859 | -388.0 | -326.5 | |
| 0.00 | 0.86 | 0.00 | 0.92 | 10.26 | 69.85 | 60.36 | 285.47 | 0.8893 | -359.0 | -332.8 | |
| 1.03 | 2.58 | 1.09 | 2.71 | 9.59 | 69.34 | 59.84 | 284.86 | 0.8840 | 364.4 | 162.1 | |
| 0.00 | 1.89 | 0.00 | 2.04 | 11.05 | 69.75 | 60.25 | 286.36 | 0.8900 | -665.0 | -588.8 | |
| 0.00 | 4.64 | 0.00 | 4.93 | 10.46 | 69.43 | 59.93 | 285.80 | 0.8864 | 69.0 | -121.2 | |
| 0.00 | 0.43 | 0.00 | 0.46 | 11.24 | 69.51 | 60.01 | 286.63 | 0.8885 | -496.0 | -459.8 | |
| 0.00 | 3.09 | 0.00 | 3.23 | 10.59 | 68.87 | 59.37 | 286.08 | 0.8822 | 436.0 | 164.6 | |
| 0.95 | 4.38 | 0.98 | 4.57 | 11.24 | 68.61 | 59.11 | 286.87 | 0.8815 | -488.9 | -157.9 | |
| 0.00 | 1.46 | 0.00 | 1.45 | 8.83 | 67.66 | 58.16 | 284.45 | 0.8689 | 241.0 | 203.1 | |
| 1.81 | 346.55 | 1.78 | 330.99 | 9.92 | 67.21 | 57.71 | 285.80 | 0.8675 | 286.4 | 244.9 | |
| 1.46 | -19.00 | 1.43 | -19.00 | 10.07 | 66.91 | 57.42 | 286.05 | 0.8653 | 280.9 | 999999 | |
| 1.81 | -19.00 | 1.77 | -19.00 | 10.57 | 66.72 | 57.23 | 286.67 | 0.8648 | -243.8 | 999999 | |
| 18.57 | -19.00 | 18.02 | -19.00 | 10.36 | 66.44 | 56.94 | 286.51 | 0.8620 | 509.3 | 999999 | |
| 10.92 | -19.00 | 10.45 | -19.00 | 9.47 | 66.19 | 56.70 | 285.58 | 0.8579 | 719.1 | 999999 | |
| 0.52 | 1.72 | 0.50 | 1.68 | 11.38 | 66.41 | 56.91 | 287.66 | 0.8640 | 164.5 | 109.4 | |
| 0.00 | 2.92 | 0.00 | 2.83 | 11.40 | 66.08 | 56.59 | 287.79 | 0.8614 | 287.0 | 286.5 | |
| 43.24 | -19.00 | 40.78 | -19.00 | 10.40 | 65.35 | 55.85 | 286.88 | 0.8527 | 1011.1 | 999999 | |
| 0.00 | 1.29 | 0.00 | 1.23 | 11.48 | 65.61 | 56.11 | 288.02 | 0.8576 | 373.0 | 236.5 | |
| 1.03 | -19.00 | 0.97 | -19.00 | 11.02 | 65.09 | 55.60 | 287.66 | 0.8520 | 609.9 | 999999 | |
| 0.00 | 0.95 | 0.00 | 0.86 | 11.27 | 63.89 | 54.39 | 288.32 | 0.8421 | 542.0 | 492.3 | |
| Proj. U | - Projected umbra area in millionths of solar disc, negative values indicate | |
|
that the umbra consists of fragmented regions which cannot be separated without losing umbral area. In this way several spots (intensity minima in the umbra) have a common umbra, e.g. -2 means that the given spot shares an umbra with spot No.2, and the common U value is indicated at spot No.2. |
||
| Proj. WS | - Projected whole spot area in millionths of solar disc, negative values indicate | |
|
that several umbras have a common penumbra, e.g. -7 means that the given umbra shares a penumbra with umbra No.7, and the WS value is indicated at No.7. |
||
| Corr. U | - Corrected umbra area in millionths of solar hemisphere, for negative values see above | |
| Corr. WS | - Corrected whole spot area in millionths of solar hemisphere, for negative values see above | |
| B | - Heliographic latitude B; positive: North, negative: South | |
| L | - Heliographic longitude L | |
| LCM | - Longitudinal distance from the Sun's central meridian | |
| Pos. angle | - Position angle | |
| r | - Distance from the centre of Sun's disc in terms of Sun's radius | |
| MU | - Mean magnetic field within the umbra contour averaged the pixel values with sign. | |
| MP | - Mean magnetic field within the penumbra contour averaged the pixel values with sign. | |