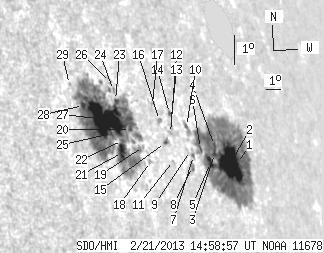
SDO HMI 2013-02-21 14:58:57 UT
See sunspots with tool (Click here to study sunspot positions and configurations with tool using white-light and magnetogram images and polarity drawing)
(It is recommended to set high resolution on your display!)
| group | Proj. U | Proj. WS | Corr. U | Corr. WS | B | L | LCM | Pos. angle | r | MU | MP |
| 128.65 | 673.38 | 146.52 | 782.28 | 10.16 | 69.86 | 62.56 | 284.85 | 0.9037 | 58.6 | -1.0 | |
|
previous
or next observation for the same group /
back to the solar disc SDO HMI 2013-02-21 14:58:57 UT
See sunspots with tool (Click here to study sunspot positions and configurations with tool using white-light and magnetogram images and polarity drawing) (It is recommended to set high resolution on your display!) |
| spot | Proj. U | Proj. WS | Corr. U | Corr. WS | B | L | LCM | Pos. angle | r | MU | MP |
| 6.36 | 310.13 | 8.66 | 410.12 | 10.06 | 74.13 | 66.83 | 283.72 | 0.9334 | 407.6 | -172.6 | |
| 34.37 | -1.00 | 45.61 | -1.00 | 9.96 | 73.48 | 66.18 | 283.75 | 0.9292 | -821.6 | 999999 | |
| 3.61 | -1.00 | 4.61 | -1.00 | 10.18 | 72.46 | 65.16 | 284.21 | 0.9231 | -675.5 | 999999 | |
| 1.37 | -1.00 | 1.76 | -1.00 | 10.44 | 72.56 | 65.26 | 284.46 | 0.9241 | -543.4 | 999999 | |
| 5.07 | -1.00 | 6.34 | -1.00 | 9.85 | 72.04 | 64.75 | 283.96 | 0.9199 | -897.8 | 999999 | |
| 1.12 | -1.00 | 1.37 | -1.00 | 10.22 | 71.48 | 64.18 | 284.48 | 0.9167 | -657.3 | 999999 | |
| 0.60 | 1.98 | 0.72 | 2.37 | 9.94 | 70.89 | 63.59 | 284.31 | 0.9122 | -641.4 | -552.3 | |
| 0.00 | 3.95 | 0.00 | 4.68 | 9.58 | 70.69 | 63.40 | 283.97 | 0.9103 | -743.0 | -564.4 | |
| 0.00 | 0.52 | 0.00 | 0.62 | 10.07 | 70.73 | 63.43 | 284.50 | 0.9114 | -446.0 | -485.0 | |
| 0.77 | 5.76 | 0.93 | 6.91 | 10.81 | 70.74 | 63.44 | 285.29 | 0.9126 | -432.1 | -388.9 | |
| 0.00 | 0.77 | 0.00 | 0.88 | 9.62 | 69.45 | 62.15 | 284.32 | 0.9015 | 200.0 | 165.4 | |
| 0.00 | 1.98 | 0.00 | 2.27 | 10.46 | 69.54 | 62.24 | 285.21 | 0.9036 | -408.0 | -404.9 | |
| 0.00 | 2.75 | 0.00 | 3.17 | 10.72 | 69.63 | 62.34 | 285.46 | 0.9047 | -414.0 | -311.7 | |
| 0.95 | 2.06 | 1.10 | 2.39 | 11.10 | 69.71 | 62.41 | 285.85 | 0.9059 | -572.5 | -459.2 | |
| 1.12 | 3.18 | 1.26 | 3.59 | 10.14 | 69.10 | 61.80 | 284.96 | 0.8999 | 268.6 | 28.0 | |
| 0.00 | 2.15 | 0.00 | 2.42 | 10.80 | 68.95 | 61.65 | 285.72 | 0.8999 | 444.0 | 298.7 | |
| 0.00 | 1.72 | 0.00 | 1.93 | 11.29 | 68.68 | 61.38 | 286.32 | 0.8989 | -514.0 | -311.1 | |
| 0.00 | 1.55 | 0.00 | 1.66 | 9.43 | 67.93 | 60.63 | 284.48 | 0.8898 | -7.0 | -52.8 | |
| 0.00 | 0.95 | 0.00 | 1.01 | 9.85 | 67.63 | 60.33 | 285.02 | 0.8883 | 40.0 | 20.0 | |
| 1.63 | 329.98 | 1.72 | 334.23 | 10.31 | 66.98 | 59.68 | 285.69 | 0.8841 | 101.4 | 254.1 | |
| 11.09 | -20.00 | 11.33 | -20.00 | 9.52 | 66.27 | 58.97 | 285.01 | 0.8769 | 622.9 | 999999 | |
| 1.55 | -20.00 | 1.59 | -20.00 | 9.90 | 66.38 | 59.08 | 285.40 | 0.8786 | -357.9 | 999999 | |
| 1.12 | -20.00 | 1.16 | -20.00 | 11.13 | 66.35 | 59.06 | 286.77 | 0.8809 | 147.5 | 999999 | |
| 0.00 | 1.63 | 0.00 | 1.70 | 11.44 | 66.34 | 59.04 | 287.11 | 0.8814 | 96.0 | 82.6 | |
| 1.72 | -20.00 | 1.74 | -20.00 | 10.05 | 65.78 | 58.48 | 285.73 | 0.8741 | 501.2 | 999999 | |
| 0.00 | 1.20 | 0.00 | 1.25 | 11.68 | 66.25 | 58.95 | 287.40 | 0.8812 | 207.0 | 125.4 | |
| 53.45 | -20.00 | 53.93 | -20.00 | 10.46 | 65.56 | 58.26 | 286.25 | 0.8731 | 859.8 | 999999 | |
| 2.75 | -20.00 | 2.69 | -20.00 | 10.77 | 64.40 | 57.10 | 286.93 | 0.8642 | 781.9 | 999999 | |
| 0.00 | 1.12 | 0.00 | 1.08 | 11.36 | 63.80 | 56.50 | 287.76 | 0.8605 | 415.0 | 345.4 | |
| Proj. U | - Projected umbra area in millionths of solar disc, negative values indicate | |
|
that the umbra consists of fragmented regions which cannot be separated without losing umbral area. In this way several spots (intensity minima in the umbra) have a common umbra, e.g. -2 means that the given spot shares an umbra with spot No.2, and the common U value is indicated at spot No.2. |
||
| Proj. WS | - Projected whole spot area in millionths of solar disc, negative values indicate | |
|
that several umbras have a common penumbra, e.g. -7 means that the given umbra shares a penumbra with umbra No.7, and the WS value is indicated at No.7. |
||
| Corr. U | - Corrected umbra area in millionths of solar hemisphere, for negative values see above | |
| Corr. WS | - Corrected whole spot area in millionths of solar hemisphere, for negative values see above | |
| B | - Heliographic latitude B; positive: North, negative: South | |
| L | - Heliographic longitude L | |
| LCM | - Longitudinal distance from the Sun's central meridian | |
| Pos. angle | - Position angle | |
| r | - Distance from the centre of Sun's disc in terms of Sun's radius | |
| MU | - Mean magnetic field within the umbra contour averaged the pixel values with sign. | |
| MP | - Mean magnetic field within the penumbra contour averaged the pixel values with sign. | |