SDO HMI 2013-02-21 19:58:57 UT
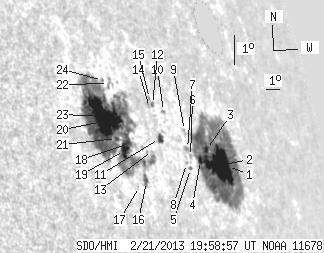
See sunspots with tool (Click here to study sunspot positions and configurations with tool using white-light and magnetogram images and polarity drawing)
(It is recommended to set high resolution on your display!)
| group | Proj. U | Proj. WS | Corr. U | Corr. WS | B | L | LCM | Pos. angle | r | MU | MP |
| 113.81 | 609.19 | 146.71 | 783.90 | 10.11 | 69.82 | 65.28 | 284.17 | 0.9220 | -20.1 | 15.7 | |
|
previous
or next observation for the same group /
back to the solar disc SDO HMI 2013-02-21 19:58:57 UT
See sunspots with tool (Click here to study sunspot positions and configurations with tool using white-light and magnetogram images and polarity drawing) (It is recommended to set high resolution on your display!) |
| spot | Proj. U | Proj. WS | Corr. U | Corr. WS | B | L | LCM | Pos. angle | r | MU | MP |
| 9.19 | 272.68 | 14.25 | 408.54 | 9.98 | 74.11 | 69.57 | 283.07 | 0.9489 | 411.3 | -169.2 | |
| 39.17 | -1.00 | 58.26 | -1.00 | 9.91 | 73.31 | 68.77 | 283.16 | 0.9445 | -741.4 | 999999 | |
| 2.49 | -1.00 | 3.58 | -1.00 | 10.31 | 72.50 | 67.96 | 283.74 | 0.9404 | -679.4 | 999999 | |
| 2.41 | -1.00 | 3.34 | -1.00 | 9.89 | 71.84 | 67.29 | 283.45 | 0.9360 | -734.3 | 999999 | |
| 0.34 | 1.37 | 0.46 | 1.83 | 9.54 | 70.92 | 66.38 | 283.28 | 0.9300 | -567.5 | -556.2 | |
| 0.00 | 1.89 | 0.00 | 2.55 | 9.93 | 71.07 | 66.53 | 283.65 | 0.9314 | -660.0 | -610.4 | |
| 0.00 | 2.75 | 0.00 | 3.68 | 10.16 | 70.94 | 66.40 | 283.92 | 0.9309 | -523.0 | -529.3 | |
| 0.00 | 1.03 | 0.00 | 1.36 | 9.67 | 70.67 | 66.12 | 283.46 | 0.9285 | -618.0 | -573.1 | |
| 0.00 | 1.20 | 0.00 | 1.62 | 10.71 | 70.95 | 66.41 | 284.50 | 0.9317 | -350.0 | -297.9 | |
| 0.00 | 1.72 | 0.00 | 2.20 | 11.14 | 69.58 | 65.04 | 285.26 | 0.9237 | -526.0 | -459.1 | |
| 2.49 | 5.24 | 3.08 | 6.50 | 10.24 | 68.92 | 64.38 | 284.46 | 0.9181 | 211.1 | -68.2 | |
| 0.60 | 1.98 | 0.75 | 2.46 | 11.27 | 68.85 | 64.31 | 285.58 | 0.9192 | -401.6 | -378.9 | |
| 0.00 | 0.60 | 0.00 | 0.72 | 9.79 | 68.27 | 63.73 | 284.13 | 0.9130 | -285.0 | -297.9 | |
| 0.00 | 0.69 | 0.00 | 0.85 | 11.15 | 68.59 | 64.05 | 285.51 | 0.9172 | -379.0 | -285.9 | |
| 0.00 | 0.77 | 0.00 | 0.96 | 11.44 | 68.71 | 64.17 | 285.79 | 0.9185 | -613.0 | -614.4 | |
| 1.55 | 311.94 | 1.79 | 344.63 | 8.76 | 67.52 | 62.98 | 283.19 | 0.9062 | 315.2 | 258.5 | |
| 0.00 | 0.60 | 0.00 | 0.68 | 8.55 | 67.00 | 62.46 | 283.09 | 0.9020 | 352.0 | 369.3 | |
| 3.26 | -16.00 | 3.71 | -16.00 | 9.83 | 66.68 | 62.14 | 284.55 | 0.9018 | -365.3 | 999999 | |
| 8.33 | -16.00 | 9.35 | -16.00 | 9.58 | 66.34 | 61.80 | 284.36 | 0.8989 | 555.6 | 999999 | |
| 1.20 | -16.00 | 1.36 | -16.00 | 10.55 | 66.29 | 61.74 | 285.44 | 0.9002 | -130.5 | 999999 | |
| 1.29 | -16.00 | 1.43 | -16.00 | 9.90 | 65.94 | 61.39 | 284.81 | 0.8965 | 423.7 | 999999 | |
| 0.00 | 3.61 | 0.00 | 4.07 | 11.61 | 66.03 | 61.49 | 286.64 | 0.9002 | 275.0 | 195.9 | |
| 41.49 | -16.00 | 45.35 | -16.00 | 10.52 | 65.39 | 60.84 | 285.62 | 0.8935 | 831.4 | 999999 | |
| 0.00 | 1.12 | 0.00 | 1.25 | 11.66 | 65.67 | 61.13 | 286.79 | 0.8977 | 305.0 | 246.4 | |
| Proj. U | - Projected umbra area in millionths of solar disc, negative values indicate | |
|
that the umbra consists of fragmented regions which cannot be separated without losing umbral area. In this way several spots (intensity minima in the umbra) have a common umbra, e.g. -2 means that the given spot shares an umbra with spot No.2, and the common U value is indicated at spot No.2. |
||
| Proj. WS | - Projected whole spot area in millionths of solar disc, negative values indicate | |
|
that several umbras have a common penumbra, e.g. -7 means that the given umbra shares a penumbra with umbra No.7, and the WS value is indicated at No.7. |
||
| Corr. U | - Corrected umbra area in millionths of solar hemisphere, for negative values see above | |
| Corr. WS | - Corrected whole spot area in millionths of solar hemisphere, for negative values see above | |
| B | - Heliographic latitude B; positive: North, negative: South | |
| L | - Heliographic longitude L | |
| LCM | - Longitudinal distance from the Sun's central meridian | |
| Pos. angle | - Position angle | |
| r | - Distance from the centre of Sun's disc in terms of Sun's radius | |
| MU | - Mean magnetic field within the umbra contour averaged the pixel values with sign. | |
| MP | - Mean magnetic field within the penumbra contour averaged the pixel values with sign. | |