SDO HMI 2013-07-21 10:59:10 UT
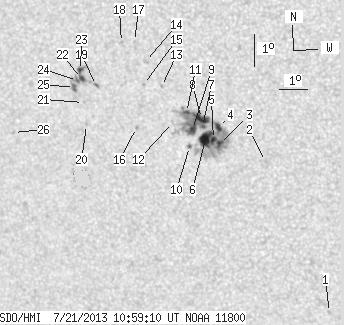
See sunspots with tool (Click here to study sunspot positions and configurations with tool using white-light and magnetogram images and polarity drawing)
(It is recommended to set high resolution on your display!)
| group | Proj. U | Proj. WS | Corr. U | Corr. WS | B | L | LCM | Pos. angle | r | MU | MP |
| 51.83 | 180.94 | 29.98 | 104.87 | -8.29 | 159.31 | -28.27 | 115.09 | 0.5193 | 362.7 | 187.9 | |
|
previous
or next observation for the same group /
back to the solar disc SDO HMI 2013-07-21 10:59:10 UT
See sunspots with tool (Click here to study sunspot positions and configurations with tool using white-light and magnetogram images and polarity drawing) (It is recommended to set high resolution on your display!) |
| spot | Proj. U | Proj. WS | Corr. U | Corr. WS | B | L | LCM | Pos. angle | r | MU | MP |
| 0.00 | 1.27 | 0.00 | 0.73 | -14.14 | 163.86 | -23.72 | 129.35 | 0.5063 | 674.0 | 614.8 | |
| 0.00 | 1.09 | 0.00 | 0.62 | -9.41 | 162.13 | -25.45 | 119.45 | 0.4888 | 757.0 | 607.5 | |
| 3.45 | 138.46 | 1.98 | 79.70 | -8.90 | 160.58 | -26.99 | 117.13 | 0.5058 | 1103.8 | 396.2 | |
| 4.45 | -3.00 | 2.54 | -3.00 | -8.40 | 160.59 | -26.99 | 116.24 | 0.5025 | 1124.5 | 999999 | |
| 2.45 | -3.00 | 1.41 | -3.00 | -8.78 | 160.38 | -27.19 | 116.75 | 0.5077 | 1223.0 | 999999 | |
| 13.88 | -3.00 | 7.99 | -3.00 | -8.76 | 160.11 | -27.47 | 116.49 | 0.5113 | 1026.0 | 999999 | |
| 1.36 | -3.00 | 0.78 | -3.00 | -8.39 | 160.03 | -27.54 | 115.76 | 0.5099 | 579.3 | 999999 | |
| 8.89 | -3.00 | 5.11 | -3.00 | -8.14 | 160.02 | -27.56 | 115.30 | 0.5085 | 936.1 | 999999 | |
| 5.81 | -3.00 | 3.35 | -3.00 | -8.50 | 159.68 | -27.90 | 115.66 | 0.5154 | 739.0 | 999999 | |
| 0.82 | 2.00 | 0.47 | 1.16 | -9.04 | 159.53 | -28.05 | 116.49 | 0.5208 | 575.0 | 438.4 | |
| 1.91 | -3.00 | 1.10 | -3.00 | -7.97 | 159.51 | -28.07 | 114.60 | 0.5144 | 695.3 | 999999 | |
| 0.00 | 1.63 | 0.00 | 0.95 | -8.31 | 158.99 | -28.58 | 114.79 | 0.5235 | -618.0 | -462.7 | |
| 0.00 | 1.36 | 0.00 | 0.79 | -7.20 | 158.69 | -28.88 | 112.60 | 0.5211 | -586.0 | -409.3 | |
| 0.00 | 2.36 | 0.00 | 1.37 | -6.44 | 158.18 | -29.39 | 110.89 | 0.5241 | -627.0 | -481.8 | |
| 0.00 | 0.82 | 0.00 | 0.48 | -7.16 | 158.06 | -29.51 | 112.09 | 0.5296 | -626.0 | -559.1 | |
| 0.00 | 1.18 | 0.00 | 0.69 | -8.52 | 157.70 | -29.87 | 114.19 | 0.5421 | -772.0 | -651.2 | |
| 0.00 | 0.91 | 0.00 | 0.53 | -5.83 | 157.83 | -29.74 | 109.57 | 0.5259 | -706.0 | -623.1 | |
| 0.00 | 1.36 | 0.00 | 0.80 | -5.89 | 157.37 | -30.21 | 109.38 | 0.5326 | -849.0 | -617.9 | |
| 0.64 | 1.91 | 0.38 | 1.13 | -7.26 | 156.38 | -31.20 | 111.16 | 0.5531 | -898.1 | -718.9 | |
| 0.00 | 1.00 | 0.00 | 0.60 | -8.50 | 155.91 | -31.67 | 112.93 | 0.5659 | 572.0 | 429.8 | |
| 0.00 | 0.82 | 0.00 | 0.49 | -7.82 | 155.86 | -31.71 | 111.77 | 0.5629 | -584.0 | -481.2 | |
| 2.63 | 23.23 | 1.57 | 13.87 | -7.07 | 155.85 | -31.72 | 110.51 | 0.5592 | -1018.5 | -661.5 | |
| 2.27 | -22.00 | 1.35 | -22.00 | -6.82 | 155.83 | -31.74 | 110.08 | 0.5583 | -840.5 | 999999 | |
| 1.09 | -22.00 | 0.65 | -22.00 | -7.14 | 155.70 | -31.87 | 110.53 | 0.5616 | -799.7 | 999999 | |
| 2.18 | -22.00 | 1.30 | -22.00 | -7.36 | 155.57 | -32.00 | 110.83 | 0.5644 | -836.8 | 999999 | |
| 0.00 | 1.54 | 0.00 | 0.96 | -8.88 | 153.18 | -34.39 | 111.86 | 0.6035 | 611.0 | 432.1 | |
| Proj. U | - Projected umbra area in millionths of solar disc, negative values indicate | |
|
that the umbra consists of fragmented regions which cannot be separated without losing umbral area. In this way several spots (intensity minima in the umbra) have a common umbra, e.g. -2 means that the given spot shares an umbra with spot No.2, and the common U value is indicated at spot No.2. |
||
| Proj. WS | - Projected whole spot area in millionths of solar disc, negative values indicate | |
|
that several umbras have a common penumbra, e.g. -7 means that the given umbra shares a penumbra with umbra No.7, and the WS value is indicated at No.7. |
||
| Corr. U | - Corrected umbra area in millionths of solar hemisphere, for negative values see above | |
| Corr. WS | - Corrected whole spot area in millionths of solar hemisphere, for negative values see above | |
| B | - Heliographic latitude B; positive: North, negative: South | |
| L | - Heliographic longitude L | |
| LCM | - Longitudinal distance from the Sun's central meridian | |
| Pos. angle | - Position angle | |
| r | - Distance from the centre of Sun's disc in terms of Sun's radius | |
| MU | - Mean magnetic field within the umbra contour averaged the pixel values with sign. | |
| MP | - Mean magnetic field within the penumbra contour averaged the pixel values with sign. | |