SDO HMI 2013-07-22 05:59:10 UT
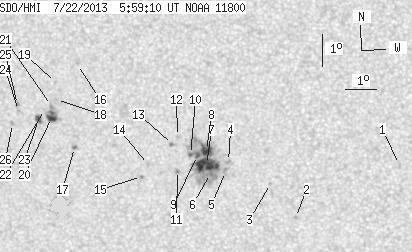
See sunspots with tool (Click here to study sunspot positions and configurations with tool using white-light and magnetogram images and polarity drawing)
(It is recommended to set high resolution on your display!)
| group | Proj. U | Proj. WS | Corr. U | Corr. WS | B | L | LCM | Pos. angle | r | MU | MP |
| 44.28 | 158.51 | 23.72 | 84.88 | -8.49 | 159.49 | -17.59 | 127.76 | 0.3793 | 458.0 | 297.0 | |
|
previous
or next observation for the same group /
back to the solar disc SDO HMI 2013-07-22 05:59:10 UT
See sunspots with tool (Click here to study sunspot positions and configurations with tool using white-light and magnetogram images and polarity drawing) (It is recommended to set high resolution on your display!) |
| spot | Proj. U | Proj. WS | Corr. U | Corr. WS | B | L | LCM | Pos. angle | r | MU | MP |
| 0.00 | 1.27 | 0.00 | 0.66 | -8.72 | 166.58 | -10.50 | 142.63 | 0.2981 | 730.0 | 537.1 | |
| 0.00 | 1.36 | 0.00 | 0.72 | -10.45 | 163.23 | -13.85 | 138.27 | 0.3553 | 983.0 | 701.2 | |
| 0.00 | 1.00 | 0.00 | 0.53 | -9.39 | 162.48 | -14.60 | 134.67 | 0.3513 | 857.0 | 664.9 | |
| 0.00 | 3.08 | 0.00 | 1.64 | -8.73 | 161.17 | -15.92 | 130.83 | 0.3598 | 1101.0 | 832.9 | |
| 0.00 | 3.63 | 0.00 | 1.93 | -9.05 | 161.06 | -16.03 | 131.30 | 0.3645 | 695.0 | 743.0 | |
| 0.64 | 108.69 | 0.34 | 57.92 | -9.12 | 160.57 | -16.51 | 130.61 | 0.3712 | 715.1 | 429.1 | |
| 21.05 | -6.00 | 11.22 | -6.00 | -8.84 | 160.46 | -16.63 | 129.83 | 0.3698 | 1170.7 | 999999 | |
| 9.62 | -6.00 | 5.11 | -6.00 | -8.40 | 160.48 | -16.61 | 128.92 | 0.3650 | 1157.8 | 999999 | |
| 2.27 | -6.00 | 1.21 | -6.00 | -8.57 | 160.18 | -16.91 | 128.78 | 0.3704 | 955.9 | 999999 | |
| 1.00 | -6.00 | 0.53 | -6.00 | -8.54 | 159.96 | -17.13 | 128.35 | 0.3730 | 788.5 | 999999 | |
| 0.00 | 2.36 | 0.00 | 1.26 | -9.05 | 159.51 | -17.58 | 128.71 | 0.3838 | 830.0 | 691.6 | |
| 0.00 | 1.91 | 0.00 | 1.02 | -7.99 | 159.56 | -17.52 | 126.53 | 0.3727 | 698.0 | 526.5 | |
| 0.00 | 2.72 | 0.00 | 1.46 | -8.24 | 159.39 | -17.70 | 126.81 | 0.3774 | 758.0 | 556.4 | |
| 0.00 | 1.81 | 0.00 | 0.98 | -8.89 | 158.58 | -18.51 | 126.94 | 0.3940 | 732.0 | 564.7 | |
| 0.00 | 1.27 | 0.00 | 0.69 | -9.27 | 158.33 | -18.76 | 127.35 | 0.4009 | 793.0 | 616.3 | |
| 0.00 | 1.00 | 0.00 | 0.54 | -5.84 | 156.41 | -20.68 | 117.46 | 0.3976 | -833.0 | -677.2 | |
| 0.54 | 1.91 | 0.30 | 1.04 | -8.43 | 156.18 | -20.91 | 122.71 | 0.4213 | 916.5 | 740.5 | |
| 0.00 | 1.09 | 0.00 | 0.59 | -6.95 | 155.67 | -21.42 | 119.03 | 0.4163 | -794.0 | -668.5 | |
| 0.00 | 1.00 | 0.00 | 0.54 | -6.42 | 155.66 | -21.43 | 117.89 | 0.4124 | -872.0 | -619.6 | |
| 6.44 | 10.71 | 3.52 | 5.85 | -7.51 | 155.47 | -21.61 | 119.99 | 0.4234 | -1030.3 | -758.8 | |
| 0.00 | 2.90 | 0.00 | 1.58 | -7.14 | 155.49 | -21.59 | 119.23 | 0.4202 | -699.0 | -615.0 | |
| 0.00 | 1.27 | 0.00 | 0.69 | -7.27 | 155.25 | -21.83 | 119.24 | 0.4245 | -194.0 | -181.8 | |
| 2.72 | 4.45 | 1.49 | 2.44 | -7.59 | 155.04 | -22.05 | 119.65 | 0.4299 | -927.7 | -651.7 | |
| 0.00 | 1.18 | 0.00 | 0.65 | -7.33 | 154.39 | -22.70 | 118.41 | 0.4369 | -739.0 | -594.9 | |
| 0.00 | 2.09 | 0.00 | 1.15 | -7.14 | 154.36 | -22.72 | 118.00 | 0.4359 | -976.0 | -769.4 | |
| 0.00 | 1.81 | 0.00 | 1.00 | -7.74 | 154.16 | -22.92 | 119.00 | 0.4431 | -813.0 | -691.5 | |
| Proj. U | - Projected umbra area in millionths of solar disc, negative values indicate | |
|
that the umbra consists of fragmented regions which cannot be separated without losing umbral area. In this way several spots (intensity minima in the umbra) have a common umbra, e.g. -2 means that the given spot shares an umbra with spot No.2, and the common U value is indicated at spot No.2. |
||
| Proj. WS | - Projected whole spot area in millionths of solar disc, negative values indicate | |
|
that several umbras have a common penumbra, e.g. -7 means that the given umbra shares a penumbra with umbra No.7, and the WS value is indicated at No.7. |
||
| Corr. U | - Corrected umbra area in millionths of solar hemisphere, for negative values see above | |
| Corr. WS | - Corrected whole spot area in millionths of solar hemisphere, for negative values see above | |
| B | - Heliographic latitude B; positive: North, negative: South | |
| L | - Heliographic longitude L | |
| LCM | - Longitudinal distance from the Sun's central meridian | |
| Pos. angle | - Position angle | |
| r | - Distance from the centre of Sun's disc in terms of Sun's radius | |
| MU | - Mean magnetic field within the umbra contour averaged the pixel values with sign. | |
| MP | - Mean magnetic field within the penumbra contour averaged the pixel values with sign. | |