SDO HMI 2013-07-25 14:59:10 UT
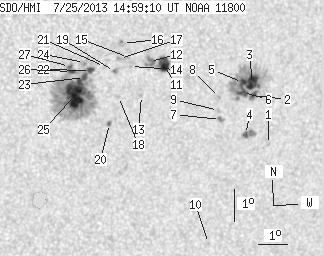
See sunspots with tool (Click here to study sunspot positions and configurations with tool using white-light and magnetogram images and polarity drawing)
(It is recommended to set high resolution on your display!)
| group | Proj. U | Proj. WS | Corr. U | Corr. WS | B | L | LCM | Pos. angle | r | MU | MP |
| 87.55 | 339.60 | 49.77 | 192.62 | -7.12 | 158.76 | 26.31 | 244.83 | 0.4871 | -31.4 | -46.8 | |
|
previous
or next observation for the same group /
back to the solar disc SDO HMI 2013-07-25 14:59:10 UT
See sunspots with tool (Click here to study sunspot positions and configurations with tool using white-light and magnetogram images and polarity drawing) (It is recommended to set high resolution on your display!) |
| spot | Proj. U | Proj. WS | Corr. U | Corr. WS | B | L | LCM | Pos. angle | r | MU | MP |
| 0.00 | 1.09 | 0.00 | 0.65 | -9.09 | 163.31 | 30.87 | 245.09 | 0.5607 | 553.0 | 516.8 | |
| 3.08 | 92.71 | 1.81 | 54.39 | -7.52 | 162.64 | 30.20 | 247.24 | 0.5428 | 739.3 | 497.4 | |
| 13.87 | -2.00 | 8.15 | -2.00 | -7.12 | 162.58 | 30.13 | 247.90 | 0.5397 | 1011.8 | 999999 | |
| 2.18 | 9.15 | 1.29 | 5.42 | -8.73 | 162.46 | 30.01 | 245.06 | 0.5473 | 928.2 | 733.3 | |
| 4.71 | -2.00 | 2.76 | -2.00 | -7.10 | 162.22 | 29.77 | 247.69 | 0.5347 | 1256.9 | 999999 | |
| 6.25 | -2.00 | 3.67 | -2.00 | -7.41 | 162.24 | 29.80 | 247.16 | 0.5368 | 994.3 | 999999 | |
| 0.00 | 3.53 | 0.00 | 2.06 | -8.22 | 161.53 | 29.08 | 245.24 | 0.5318 | 824.0 | 741.0 | |
| 0.00 | 1.18 | 0.00 | 0.69 | -7.53 | 161.44 | 28.99 | 246.37 | 0.5265 | 897.0 | 755.6 | |
| 0.00 | 1.45 | 0.00 | 0.85 | -7.93 | 161.43 | 28.99 | 245.66 | 0.5289 | 894.0 | 679.4 | |
| 0.00 | 1.00 | 0.00 | 0.59 | -12.13 | 161.49 | 29.04 | 238.77 | 0.5572 | 688.0 | 496.2 | |
| 11.78 | 16.77 | 6.70 | 9.53 | -6.41 | 159.42 | 26.97 | 246.86 | 0.4921 | 924.1 | 717.3 | |
| 0.00 | 7.16 | 0.00 | 4.05 | -6.30 | 158.93 | 26.49 | 246.69 | 0.4846 | 947.0 | 841.8 | |
| 0.00 | 1.36 | 0.00 | 0.77 | -7.34 | 158.72 | 26.27 | 244.54 | 0.4882 | -595.0 | -509.9 | |
| 0.00 | 1.00 | 0.00 | 0.56 | -6.42 | 158.29 | 25.84 | 245.92 | 0.4764 | 729.0 | 623.5 | |
| 0.00 | 1.45 | 0.00 | 0.81 | -6.14 | 158.21 | 25.76 | 246.39 | 0.4735 | 294.0 | 222.2 | |
| 0.00 | 3.81 | 0.00 | 2.13 | -5.70 | 157.98 | 25.54 | 247.08 | 0.4676 | 589.0 | 519.3 | |
| 0.00 | 2.81 | 0.00 | 1.57 | -6.16 | 157.90 | 25.46 | 246.10 | 0.4693 | -610.0 | -241.8 | |
| 0.00 | 1.27 | 0.00 | 0.71 | -7.34 | 157.93 | 25.49 | 243.85 | 0.4774 | -706.0 | -561.8 | |
| 0.45 | 2.90 | 0.25 | 1.63 | -6.56 | 157.75 | 25.31 | 245.19 | 0.4697 | -358.0 | -118.4 | |
| 1.00 | 2.36 | 0.56 | 1.33 | -8.17 | 157.68 | 25.23 | 242.05 | 0.4797 | -766.8 | -535.7 | |
| 0.00 | 2.18 | 0.00 | 1.22 | -6.39 | 157.41 | 24.96 | 245.22 | 0.4638 | -248.0 | -276.3 | |
| 2.81 | 181.62 | 1.56 | 100.99 | -6.49 | 156.94 | 24.49 | 244.58 | 0.4579 | -815.8 | -473.1 | |
| 2.36 | -22.00 | 1.31 | -22.00 | -6.70 | 156.75 | 24.30 | 243.99 | 0.4566 | -847.3 | 999999 | |
| 0.00 | 4.80 | 0.00 | 2.67 | -6.24 | 156.72 | 24.28 | 244.90 | 0.4532 | -417.0 | -268.2 | |
| 36.25 | -22.00 | 20.16 | -22.00 | -7.22 | 156.47 | 24.03 | 242.70 | 0.4564 | -1202.2 | 999999 | |
| 1.99 | -22.00 | 1.10 | -22.00 | -6.50 | 156.30 | 23.85 | 243.97 | 0.4490 | -1018.7 | 999999 | |
| 0.82 | -22.00 | 0.45 | -22.00 | -6.34 | 156.23 | 23.78 | 244.22 | 0.4469 | -949.1 | 999999 | |
| Proj. U | - Projected umbra area in millionths of solar disc, negative values indicate | |
|
that the umbra consists of fragmented regions which cannot be separated without losing umbral area. In this way several spots (intensity minima in the umbra) have a common umbra, e.g. -2 means that the given spot shares an umbra with spot No.2, and the common U value is indicated at spot No.2. |
||
| Proj. WS | - Projected whole spot area in millionths of solar disc, negative values indicate | |
|
that several umbras have a common penumbra, e.g. -7 means that the given umbra shares a penumbra with umbra No.7, and the WS value is indicated at No.7. |
||
| Corr. U | - Corrected umbra area in millionths of solar hemisphere, for negative values see above | |
| Corr. WS | - Corrected whole spot area in millionths of solar hemisphere, for negative values see above | |
| B | - Heliographic latitude B; positive: North, negative: South | |
| L | - Heliographic longitude L | |
| LCM | - Longitudinal distance from the Sun's central meridian | |
| Pos. angle | - Position angle | |
| r | - Distance from the centre of Sun's disc in terms of Sun's radius | |
| MU | - Mean magnetic field within the umbra contour averaged the pixel values with sign. | |
| MP | - Mean magnetic field within the penumbra contour averaged the pixel values with sign. | |