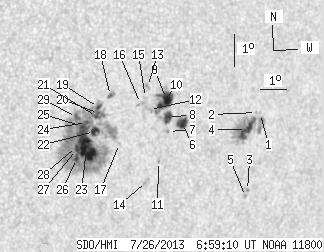
SDO HMI 2013-07-26 06:59:10 UT
See sunspots with tool (Click here to study sunspot positions and configurations with tool using white-light and magnetogram images and polarity drawing)
(It is recommended to set high resolution on your display!)
| group | Proj. U | Proj. WS | Corr. U | Corr. WS | B | L | LCM | Pos. angle | r | MU | MP |
| 94.47 | 387.07 | 58.61 | 238.62 | -6.93 | 158.03 | 34.41 | 250.63 | 0.5964 | 40.2 | -155.3 | |
|
previous
or next observation for the same group /
back to the solar disc SDO HMI 2013-07-26 06:59:10 UT
See sunspots with tool (Click here to study sunspot positions and configurations with tool using white-light and magnetogram images and polarity drawing) (It is recommended to set high resolution on your display!) |
| spot | Proj. U | Proj. WS | Corr. U | Corr. WS | B | L | LCM | Pos. angle | r | MU | MP |
| 0.00 | 1.27 | 0.00 | 0.84 | -6.61 | 163.16 | 39.54 | 253.61 | 0.6615 | 512.0 | 393.8 | |
| 0.00 | 1.00 | 0.00 | 0.66 | -6.57 | 163.00 | 39.38 | 253.60 | 0.6593 | 577.0 | 488.2 | |
| 0.00 | 1.27 | 0.00 | 0.84 | -9.00 | 162.91 | 39.29 | 250.06 | 0.6676 | 756.0 | 678.6 | |
| 13.60 | 49.23 | 8.91 | 32.26 | -7.07 | 162.65 | 39.03 | 252.71 | 0.6568 | 947.9 | 571.8 | |
| 0.00 | 2.09 | 0.00 | 1.38 | -9.18 | 162.85 | 39.23 | 249.77 | 0.6677 | 558.0 | 503.3 | |
| 8.79 | 12.42 | 5.56 | 7.85 | -6.74 | 160.13 | 36.51 | 252.06 | 0.6232 | 774.5 | 494.2 | |
| 0.00 | 1.09 | 0.00 | 0.68 | -6.96 | 159.61 | 35.99 | 251.47 | 0.6175 | 785.0 | 692.8 | |
| 6.53 | 42.07 | 4.09 | 26.28 | -6.52 | 159.54 | 35.92 | 252.12 | 0.6146 | 898.8 | 639.5 | |
| 14.23 | -8.00 | 8.89 | -8.00 | -5.92 | 159.45 | 35.83 | 253.01 | 0.6111 | 907.3 | 999999 | |
| 3.26 | -8.00 | 2.03 | -8.00 | -6.13 | 159.24 | 35.62 | 252.58 | 0.6091 | 997.3 | 999999 | |
| 0.00 | 1.27 | 0.00 | 0.80 | -7.88 | 159.32 | 35.70 | 249.91 | 0.6177 | 477.0 | 445.8 | |
| 0.00 | 2.63 | 0.00 | 1.63 | -6.23 | 158.83 | 35.21 | 252.23 | 0.6042 | 454.0 | 449.6 | |
| 0.00 | 2.36 | 0.00 | 1.46 | -5.51 | 158.71 | 35.09 | 253.31 | 0.5995 | 928.0 | 697.1 | |
| 0.00 | 3.17 | 0.00 | 1.99 | -8.48 | 158.92 | 35.31 | 248.77 | 0.6155 | 831.0 | 709.6 | |
| 0.00 | 1.27 | 0.00 | 0.78 | -5.85 | 158.66 | 35.04 | 252.75 | 0.6002 | 218.0 | 165.0 | |
| 0.00 | 3.26 | 0.00 | 2.01 | -6.02 | 158.48 | 34.86 | 252.38 | 0.5986 | -45.0 | -145.6 | |
| 0.00 | 1.18 | 0.00 | 0.72 | -7.23 | 157.79 | 34.17 | 250.09 | 0.5949 | 141.0 | 94.4 | |
| 1.09 | 3.45 | 0.66 | 2.10 | -5.71 | 157.35 | 33.73 | 252.30 | 0.5821 | -656.3 | -480.1 | |
| 1.81 | 258.04 | 1.10 | 156.34 | -6.06 | 156.93 | 33.31 | 251.51 | 0.5780 | -503.2 | -428.2 | |
| 0.82 | -19.00 | 0.49 | -19.00 | -6.25 | 156.94 | 33.32 | 251.21 | 0.5790 | -683.3 | 999999 | |
| 1.18 | -19.00 | 0.71 | -19.00 | -6.34 | 156.87 | 33.25 | 251.02 | 0.5785 | -768.1 | 999999 | |
| 5.53 | -19.00 | 3.36 | -19.00 | -6.80 | 156.84 | 33.22 | 250.24 | 0.5801 | -735.4 | 999999 | |
| 27.65 | -19.00 | 16.78 | -19.00 | -7.32 | 156.58 | 32.96 | 249.25 | 0.5793 | -1109.7 | 999999 | |
| 1.18 | -19.00 | 0.71 | -19.00 | -6.51 | 156.52 | 32.90 | 250.55 | 0.5745 | -878.9 | 999999 | |
| 2.63 | -19.00 | 1.59 | -19.00 | -6.62 | 156.38 | 32.76 | 250.27 | 0.5732 | -1065.1 | 999999 | |
| 1.63 | -19.00 | 0.99 | -19.00 | -7.61 | 156.24 | 32.62 | 248.57 | 0.5762 | -868.6 | 999999 | |
| 1.09 | -19.00 | 0.66 | -19.00 | -7.33 | 156.22 | 32.60 | 249.01 | 0.5745 | -1233.8 | 999999 | |
| 0.91 | -19.00 | 0.55 | -19.00 | -7.24 | 156.21 | 32.59 | 249.16 | 0.5739 | -1281.3 | 999999 | |
| 2.54 | -19.00 | 1.53 | -19.00 | -6.33 | 156.14 | 32.52 | 250.62 | 0.5686 | -976.8 | 999999 | |
| Proj. U | - Projected umbra area in millionths of solar disc, negative values indicate | |
|
that the umbra consists of fragmented regions which cannot be separated without losing umbral area. In this way several spots (intensity minima in the umbra) have a common umbra, e.g. -2 means that the given spot shares an umbra with spot No.2, and the common U value is indicated at spot No.2. |
||
| Proj. WS | - Projected whole spot area in millionths of solar disc, negative values indicate | |
|
that several umbras have a common penumbra, e.g. -7 means that the given umbra shares a penumbra with umbra No.7, and the WS value is indicated at No.7. |
||
| Corr. U | - Corrected umbra area in millionths of solar hemisphere, for negative values see above | |
| Corr. WS | - Corrected whole spot area in millionths of solar hemisphere, for negative values see above | |
| B | - Heliographic latitude B; positive: North, negative: South | |
| L | - Heliographic longitude L | |
| LCM | - Longitudinal distance from the Sun's central meridian | |
| Pos. angle | - Position angle | |
| r | - Distance from the centre of Sun's disc in terms of Sun's radius | |
| MU | - Mean magnetic field within the umbra contour averaged the pixel values with sign. | |
| MP | - Mean magnetic field within the penumbra contour averaged the pixel values with sign. | |