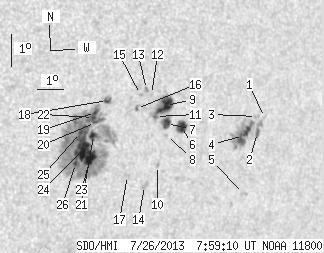
SDO HMI 2013-07-26 07:59:10 UT
See sunspots with tool (Click here to study sunspot positions and configurations with tool using white-light and magnetogram images and polarity drawing)
(It is recommended to set high resolution on your display!)
| group | Proj. U | Proj. WS | Corr. U | Corr. WS | B | L | LCM | Pos. angle | r | MU | MP |
| 94.30 | 399.94 | 58.90 | 248.30 | -7.01 | 158.06 | 34.99 | 250.82 | 0.6043 | 7.4 | -148.9 | |
|
previous
or next observation for the same group /
back to the solar disc SDO HMI 2013-07-26 07:59:10 UT
See sunspots with tool (Click here to study sunspot positions and configurations with tool using white-light and magnetogram images and polarity drawing) (It is recommended to set high resolution on your display!) |
| spot | Proj. U | Proj. WS | Corr. U | Corr. WS | B | L | LCM | Pos. angle | r | MU | MP |
| 0.00 | 1.00 | 0.00 | 0.67 | -6.63 | 163.42 | 40.34 | 253.91 | 0.6715 | 379.0 | 293.9 | |
| 1.90 | 52.04 | 1.27 | 34.39 | -7.08 | 163.18 | 40.11 | 253.16 | 0.6702 | 583.4 | 569.0 | |
| 0.00 | 2.09 | 0.00 | 1.38 | -6.57 | 163.09 | 40.02 | 253.85 | 0.6673 | 633.0 | 506.7 | |
| 10.61 | -2.00 | 7.01 | -2.00 | -7.14 | 162.62 | 39.55 | 252.85 | 0.6635 | 931.5 | 999999 | |
| 0.00 | 3.08 | 0.00 | 2.06 | -8.96 | 162.84 | 39.76 | 250.33 | 0.6733 | 835.0 | 593.3 | |
| 8.70 | 11.42 | 5.54 | 7.28 | -6.71 | 160.15 | 37.08 | 252.38 | 0.6305 | 784.7 | 461.1 | |
| 6.62 | 40.35 | 4.18 | 25.39 | -6.58 | 159.56 | 36.49 | 252.30 | 0.6224 | 912.0 | 618.8 | |
| 0.00 | 1.00 | 0.00 | 0.63 | -6.95 | 159.60 | 36.53 | 251.74 | 0.6244 | 790.0 | 636.2 | |
| 16.32 | -7.00 | 10.27 | -7.00 | -6.02 | 159.48 | 36.41 | 253.13 | 0.6191 | 956.9 | 999999 | |
| 0.00 | 1.72 | 0.00 | 1.09 | -7.88 | 159.34 | 36.27 | 250.21 | 0.6250 | 580.0 | 493.5 | |
| 0.91 | -7.00 | 0.57 | -7.00 | -6.34 | 159.13 | 36.05 | 252.46 | 0.6157 | 1043.9 | 999999 | |
| 0.00 | 1.18 | 0.00 | 0.74 | -5.64 | 158.92 | 35.85 | 253.45 | 0.6102 | 748.0 | 599.0 | |
| 0.00 | 1.72 | 0.00 | 1.07 | -5.48 | 158.72 | 35.65 | 253.63 | 0.6069 | 729.0 | 643.9 | |
| 0.00 | 4.35 | 0.00 | 2.75 | -8.48 | 158.91 | 35.84 | 249.06 | 0.6222 | 744.0 | 707.7 | |
| 0.00 | 1.27 | 0.00 | 0.79 | -5.62 | 158.50 | 35.43 | 253.30 | 0.6046 | 311.0 | 341.4 | |
| 0.54 | 2.45 | 0.34 | 1.52 | -6.05 | 158.38 | 35.31 | 252.56 | 0.6047 | -498.8 | -333.3 | |
| 0.00 | 1.99 | 0.00 | 1.25 | -8.12 | 158.23 | 35.15 | 249.23 | 0.6119 | -523.0 | -371.0 | |
| 2.27 | 4.81 | 1.39 | 2.94 | -5.74 | 157.28 | 34.21 | 252.51 | 0.5887 | -665.6 | -379.4 | |
| 1.45 | 269.47 | 0.88 | 164.35 | -6.09 | 156.86 | 33.79 | 251.72 | 0.5845 | -542.6 | -406.1 | |
| 1.45 | -19.00 | 0.89 | -19.00 | -6.40 | 156.88 | 33.81 | 251.23 | 0.5862 | -777.4 | 999999 | |
| 5.08 | -19.00 | 3.10 | -19.00 | -6.80 | 156.84 | 33.77 | 250.55 | 0.5875 | -760.6 | 999999 | |
| 2.36 | -19.00 | 1.44 | -19.00 | -6.24 | 156.80 | 33.72 | 251.44 | 0.5844 | -804.5 | 999999 | |
| 12.06 | -19.00 | 7.38 | -19.00 | -7.48 | 156.78 | 33.71 | 249.42 | 0.5900 | -956.4 | 999999 | |
| 21.22 | -19.00 | 12.93 | -19.00 | -7.22 | 156.47 | 33.39 | 249.67 | 0.5845 | -1190.7 | 999999 | |
| 1.72 | -19.00 | 1.05 | -19.00 | -6.68 | 156.35 | 33.28 | 250.47 | 0.5804 | -1195.5 | 999999 | |
| 1.09 | -19.00 | 0.66 | -19.00 | -7.64 | 156.24 | 33.17 | 248.85 | 0.5836 | -870.3 | 999999 | |
| Proj. U | - Projected umbra area in millionths of solar disc, negative values indicate | |
|
that the umbra consists of fragmented regions which cannot be separated without losing umbral area. In this way several spots (intensity minima in the umbra) have a common umbra, e.g. -2 means that the given spot shares an umbra with spot No.2, and the common U value is indicated at spot No.2. |
||
| Proj. WS | - Projected whole spot area in millionths of solar disc, negative values indicate | |
|
that several umbras have a common penumbra, e.g. -7 means that the given umbra shares a penumbra with umbra No.7, and the WS value is indicated at No.7. |
||
| Corr. U | - Corrected umbra area in millionths of solar hemisphere, for negative values see above | |
| Corr. WS | - Corrected whole spot area in millionths of solar hemisphere, for negative values see above | |
| B | - Heliographic latitude B; positive: North, negative: South | |
| L | - Heliographic longitude L | |
| LCM | - Longitudinal distance from the Sun's central meridian | |
| Pos. angle | - Position angle | |
| r | - Distance from the centre of Sun's disc in terms of Sun's radius | |
| MU | - Mean magnetic field within the umbra contour averaged the pixel values with sign. | |
| MP | - Mean magnetic field within the penumbra contour averaged the pixel values with sign. | |