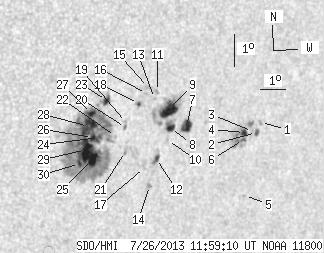
SDO HMI 2013-07-26 11:59:10 UT
See sunspots with tool (Click here to study sunspot positions and configurations with tool using white-light and magnetogram images and polarity drawing)
(It is recommended to set high resolution on your display!)
| group | Proj. U | Proj. WS | Corr. U | Corr. WS | B | L | LCM | Pos. angle | r | MU | MP |
| 99.26 | 413.08 | 63.38 | 263.05 | -6.82 | 157.88 | 37.00 | 252.13 | 0.6298 | -145.4 | -109.8 | |
|
previous
or next observation for the same group /
back to the solar disc SDO HMI 2013-07-26 11:59:10 UT
See sunspots with tool (Click here to study sunspot positions and configurations with tool using white-light and magnetogram images and polarity drawing) (It is recommended to set high resolution on your display!) |
| spot | Proj. U | Proj. WS | Corr. U | Corr. WS | B | L | LCM | Pos. angle | r | MU | MP |
| 0.00 | 2.18 | 0.00 | 1.50 | -6.79 | 163.36 | 42.49 | 254.49 | 0.6983 | 565.0 | 441.7 | |
| 1.54 | 2.99 | 1.06 | 2.06 | -7.09 | 163.23 | 42.35 | 254.02 | 0.6977 | 542.2 | 382.4 | |
| 0.00 | 1.36 | 0.00 | 0.93 | -7.05 | 163.06 | 42.18 | 254.02 | 0.6955 | 442.0 | 351.7 | |
| 3.17 | 28.83 | 2.17 | 19.68 | -7.06 | 162.73 | 41.85 | 253.88 | 0.6915 | 856.1 | 696.7 | |
| 0.00 | 0.91 | 0.00 | 0.63 | -9.05 | 162.98 | 42.10 | 251.24 | 0.7016 | 771.0 | 632.6 | |
| 1.09 | -4.00 | 0.74 | -4.00 | -7.28 | 162.71 | 41.84 | 253.57 | 0.6921 | 694.9 | 999999 | |
| 8.79 | 11.24 | 5.79 | 7.40 | -6.72 | 160.34 | 39.46 | 253.40 | 0.6609 | 717.1 | 422.9 | |
| 4.80 | 58.83 | 3.13 | 38.22 | -6.75 | 159.71 | 38.83 | 253.10 | 0.6531 | 831.0 | 526.9 | |
| 17.04 | -8.00 | 11.08 | -8.00 | -6.15 | 159.57 | 38.70 | 253.93 | 0.6492 | 1003.5 | 999999 | |
| 0.00 | 1.18 | 0.00 | 0.77 | -7.12 | 159.62 | 38.75 | 252.52 | 0.6534 | 663.0 | 466.8 | |
| 0.00 | 1.63 | 0.00 | 1.05 | -5.56 | 159.10 | 38.22 | 254.61 | 0.6409 | 777.0 | 632.8 | |
| 1.90 | 6.53 | 1.24 | 4.25 | -7.65 | 159.25 | 38.37 | 251.56 | 0.6508 | 583.6 | 458.9 | |
| 0.00 | 1.18 | 0.00 | 0.76 | -5.77 | 158.99 | 38.12 | 254.25 | 0.6404 | 628.0 | 553.4 | |
| 0.00 | 2.08 | 0.00 | 1.36 | -8.49 | 159.06 | 38.19 | 250.26 | 0.6519 | 867.0 | 779.0 | |
| 0.00 | 3.26 | 0.00 | 2.09 | -5.42 | 158.73 | 37.86 | 254.68 | 0.6357 | 776.0 | 521.5 | |
| 0.00 | 1.09 | 0.00 | 0.70 | -5.60 | 158.67 | 37.80 | 254.38 | 0.6356 | 292.0 | 245.7 | |
| 0.00 | 1.99 | 0.00 | 1.29 | -7.91 | 158.80 | 37.93 | 250.98 | 0.6463 | -270.0 | -71.3 | |
| 1.09 | 2.45 | 0.69 | 1.56 | -5.89 | 158.38 | 37.51 | 253.81 | 0.6329 | -507.7 | -425.0 | |
| 0.00 | 1.18 | 0.00 | 0.75 | -6.46 | 157.97 | 37.09 | 252.76 | 0.6297 | -513.0 | -283.7 | |
| 0.00 | 1.99 | 0.00 | 1.27 | -6.61 | 157.94 | 37.07 | 252.52 | 0.6300 | -479.0 | -346.0 | |
| 0.00 | 2.18 | 0.00 | 1.39 | -7.36 | 158.01 | 37.13 | 251.41 | 0.6339 | 670.0 | 482.4 | |
| 0.00 | 1.09 | 0.00 | 0.69 | -6.87 | 157.58 | 36.70 | 251.95 | 0.6263 | -431.0 | -326.1 | |
| 3.81 | 278.91 | 2.39 | 174.70 | -5.73 | 157.14 | 36.27 | 253.51 | 0.6161 | -656.5 | -387.5 | |
| 1.81 | -23.00 | 1.14 | -23.00 | -6.87 | 156.97 | 36.09 | 251.66 | 0.6184 | -562.0 | 999999 | |
| 9.34 | -23.00 | 5.88 | -23.00 | -7.54 | 156.76 | 35.89 | 250.52 | 0.6186 | -966.7 | 999999 | |
| 2.72 | -23.00 | 1.71 | -23.00 | -6.85 | 156.70 | 35.82 | 251.55 | 0.6148 | -944.7 | 999999 | |
| 3.99 | -23.00 | 2.49 | -23.00 | -6.10 | 156.60 | 35.73 | 252.67 | 0.6104 | -773.6 | 999999 | |
| 16.50 | -23.00 | 10.30 | -23.00 | -6.50 | 156.52 | 35.64 | 252.01 | 0.6110 | -1003.3 | 999999 | |
| 19.22 | -23.00 | 12.04 | -23.00 | -7.21 | 156.50 | 35.63 | 250.89 | 0.6139 | -1174.9 | 999999 | |
| 2.45 | -23.00 | 1.53 | -23.00 | -7.64 | 156.28 | 35.40 | 250.11 | 0.6128 | -841.9 | 999999 | |
| Proj. U | - Projected umbra area in millionths of solar disc, negative values indicate | |
|
that the umbra consists of fragmented regions which cannot be separated without losing umbral area. In this way several spots (intensity minima in the umbra) have a common umbra, e.g. -2 means that the given spot shares an umbra with spot No.2, and the common U value is indicated at spot No.2. |
||
| Proj. WS | - Projected whole spot area in millionths of solar disc, negative values indicate | |
|
that several umbras have a common penumbra, e.g. -7 means that the given umbra shares a penumbra with umbra No.7, and the WS value is indicated at No.7. |
||
| Corr. U | - Corrected umbra area in millionths of solar hemisphere, for negative values see above | |
| Corr. WS | - Corrected whole spot area in millionths of solar hemisphere, for negative values see above | |
| B | - Heliographic latitude B; positive: North, negative: South | |
| L | - Heliographic longitude L | |
| LCM | - Longitudinal distance from the Sun's central meridian | |
| Pos. angle | - Position angle | |
| r | - Distance from the centre of Sun's disc in terms of Sun's radius | |
| MU | - Mean magnetic field within the umbra contour averaged the pixel values with sign. | |
| MP | - Mean magnetic field within the penumbra contour averaged the pixel values with sign. | |