SDO HMI 2013-08-19 09:59:08 UT
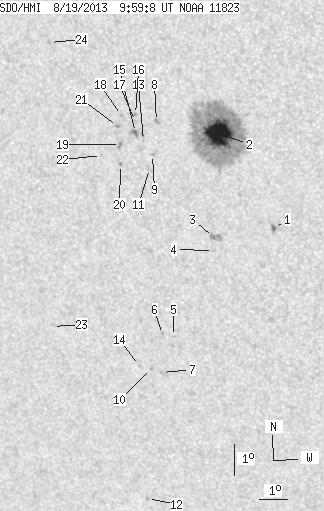
See sunspots with tool (Click here to study sunspot positions and configurations with tool using white-light and magnetogram images and polarity drawing)
(It is recommended to set high resolution on your display!)
| group | Proj. U | Proj. WS | Corr. U | Corr. WS | B | L | LCM | Pos. angle | r | MU | MP |
| 45.19 | 319.64 | 25.56 | 181.55 | -7.16 | 138.99 | -25.65 | 118.15 | 0.4894 | 487.7 | 283.0 | |
|
previous
or next observation for the same group /
back to the solar disc SDO HMI 2013-08-19 09:59:08 UT
See sunspots with tool (Click here to study sunspot positions and configurations with tool using white-light and magnetogram images and polarity drawing) (It is recommended to set high resolution on your display!) |
| spot | Proj. U | Proj. WS | Corr. U | Corr. WS | B | L | LCM | Pos. angle | r | MU | MP |
| 1.35 | 3.06 | 0.76 | 1.73 | -9.74 | 140.98 | -23.65 | 124.86 | 0.4838 | 816.4 | 640.8 | |
| 41.77 | 272.75 | 23.60 | 154.16 | -6.84 | 139.33 | -25.31 | 117.93 | 0.4824 | 1227.5 | 386.3 | |
| 0.54 | 7.56 | 0.31 | 4.35 | -10.13 | 138.92 | -25.72 | 123.26 | 0.5129 | -895.3 | -777.7 | |
| 0.00 | 0.90 | 0.00 | 0.52 | -10.54 | 138.88 | -25.76 | 123.90 | 0.5168 | -664.0 | -510.4 | |
| 0.00 | 1.35 | 0.00 | 0.81 | -13.39 | 137.18 | -27.46 | 126.56 | 0.5606 | -714.0 | -535.4 | |
| 0.00 | 1.80 | 0.00 | 1.08 | -13.35 | 136.80 | -27.84 | 126.12 | 0.5646 | -861.0 | -683.3 | |
| 0.00 | 0.54 | 0.00 | 0.33 | -14.59 | 136.60 | -28.04 | 127.71 | 0.5772 | -713.0 | -657.2 | |
| 0.00 | 2.88 | 0.00 | 1.66 | -6.58 | 137.23 | -27.41 | 115.56 | 0.5090 | 775.0 | 651.6 | |
| 0.00 | 1.53 | 0.00 | 0.89 | -7.62 | 137.02 | -27.62 | 117.20 | 0.5187 | 729.0 | 556.0 | |
| 0.00 | 1.26 | 0.00 | 0.77 | -14.48 | 136.26 | -28.38 | 127.22 | 0.5801 | -716.0 | -615.5 | |
| 0.00 | 3.06 | 0.00 | 1.78 | -8.07 | 136.88 | -27.76 | 117.85 | 0.5235 | -377.0 | -522.7 | |
| 0.00 | 0.99 | 0.00 | 0.63 | -18.82 | 135.39 | -29.25 | 132.14 | 0.6260 | 732.0 | 659.2 | |
| 0.00 | 0.81 | 0.00 | 0.47 | -7.20 | 136.74 | -27.90 | 116.23 | 0.5196 | 427.0 | 360.4 | |
| 0.00 | 0.99 | 0.00 | 0.60 | -14.40 | 135.84 | -28.80 | 126.72 | 0.5843 | -708.0 | -521.5 | |
| 1.53 | 7.20 | 0.89 | 4.17 | -6.96 | 136.48 | -28.16 | 115.60 | 0.5216 | 388.4 | 216.7 | |
| 0.00 | 1.35 | 0.00 | 0.78 | -6.40 | 136.51 | -28.13 | 114.65 | 0.5175 | 730.0 | 600.1 | |
| 0.00 | 1.17 | 0.00 | 0.68 | -6.62 | 136.50 | -28.14 | 115.02 | 0.5191 | 521.0 | 394.8 | |
| 0.00 | 1.08 | 0.00 | 0.63 | -6.46 | 136.02 | -28.62 | 114.36 | 0.5245 | -745.0 | -516.3 | |
| 0.00 | 2.97 | 0.00 | 1.74 | -7.37 | 135.92 | -28.71 | 115.85 | 0.5315 | -905.0 | -771.7 | |
| 0.00 | 1.62 | 0.00 | 0.95 | -8.00 | 135.88 | -28.76 | 116.87 | 0.5363 | -815.0 | -701.2 | |
| 0.00 | 2.07 | 0.00 | 1.21 | -6.81 | 135.86 | -28.78 | 114.84 | 0.5289 | -923.0 | -695.9 | |
| 0.00 | 1.08 | 0.00 | 0.64 | -7.75 | 135.23 | -29.41 | 115.94 | 0.5432 | -609.0 | -458.4 | |
| 0.00 | 0.27 | 0.00 | 0.17 | -13.33 | 132.84 | -31.80 | 122.55 | 0.6105 | -545.0 | -584.3 | |
| 0.00 | 1.35 | 0.00 | 0.80 | -4.34 | 133.61 | -31.03 | 108.98 | 0.5457 | -673.0 | -575.9 | |
| Proj. U | - Projected umbra area in millionths of solar disc, negative values indicate | |
|
that the umbra consists of fragmented regions which cannot be separated without losing umbral area. In this way several spots (intensity minima in the umbra) have a common umbra, e.g. -2 means that the given spot shares an umbra with spot No.2, and the common U value is indicated at spot No.2. |
||
| Proj. WS | - Projected whole spot area in millionths of solar disc, negative values indicate | |
|
that several umbras have a common penumbra, e.g. -7 means that the given umbra shares a penumbra with umbra No.7, and the WS value is indicated at No.7. |
||
| Corr. U | - Corrected umbra area in millionths of solar hemisphere, for negative values see above | |
| Corr. WS | - Corrected whole spot area in millionths of solar hemisphere, for negative values see above | |
| B | - Heliographic latitude B; positive: North, negative: South | |
| L | - Heliographic longitude L | |
| LCM | - Longitudinal distance from the Sun's central meridian | |
| Pos. angle | - Position angle | |
| r | - Distance from the centre of Sun's disc in terms of Sun's radius | |
| MU | - Mean magnetic field within the umbra contour averaged the pixel values with sign. | |
| MP | - Mean magnetic field within the penumbra contour averaged the pixel values with sign. | |