SDO HMI 2013-10-15 13:59:01 UT
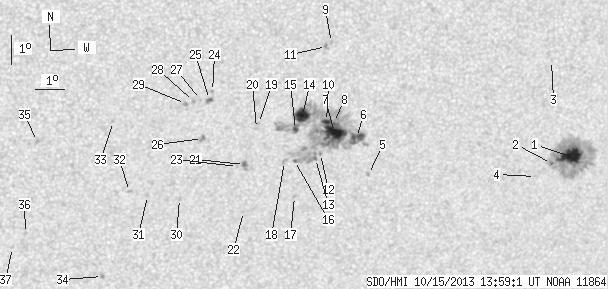
See sunspots with tool (Click here to study sunspot positions and configurations with tool using white-light and magnetogram images and polarity drawing)
(It is recommended to set high resolution on your display!)
| group | Proj. U | Proj. WS | Corr. U | Corr. WS | B | L | LCM | Pos. angle | r | MU | MP |
| 75.54 | 412.43 | 45.32 | 247.78 | -21.89 | 150.28 | 20.36 | 214.63 | 0.5650 | 184.3 | 84.8 | |
|
previous
or next observation for the same group /
back to the solar disc SDO HMI 2013-10-15 13:59:01 UT
See sunspots with tool (Click here to study sunspot positions and configurations with tool using white-light and magnetogram images and polarity drawing) (It is recommended to set high resolution on your display!) |
| spot | Proj. U | Proj. WS | Corr. U | Corr. WS | B | L | LCM | Pos. angle | r | MU | MP |
| 21.66 | 130.38 | 13.72 | 82.64 | -22.67 | 156.47 | 26.55 | 221.44 | 0.6254 | 1121.6 | 328.5 | |
| 0.87 | -1.00 | 0.55 | -1.00 | -22.88 | 155.82 | 25.91 | 220.53 | 0.6217 | 712.8 | 999999 | |
| 0.00 | 0.79 | 0.00 | 0.48 | -19.40 | 155.18 | 25.26 | 223.99 | 0.5818 | 730.0 | 598.9 | |
| 0.00 | 1.40 | 0.00 | 0.88 | -23.30 | 155.33 | 25.41 | 219.53 | 0.6215 | 694.0 | 497.5 | |
| 0.00 | 1.31 | 0.00 | 0.79 | -22.98 | 149.39 | 19.48 | 212.80 | 0.5688 | 727.0 | 627.0 | |
| 9.78 | 236.74 | 5.79 | 138.79 | -21.70 | 148.80 | 18.88 | 213.34 | 0.5492 | 791.3 | 23.7 | |
| 18.25 | -6.00 | 10.73 | -6.00 | -21.51 | 148.03 | 18.11 | 212.48 | 0.5407 | 1012.4 | 999999 | |
| 1.05 | -6.00 | 0.61 | -6.00 | -21.17 | 147.95 | 18.03 | 212.73 | 0.5360 | -677.8 | 999999 | |
| 0.00 | 1.31 | 0.00 | 0.75 | -18.51 | 147.58 | 17.66 | 215.23 | 0.5007 | -852.0 | -657.9 | |
| 3.06 | -6.00 | 1.79 | -6.00 | -21.13 | 147.71 | 17.79 | 212.43 | 0.5336 | -785.3 | 999999 | |
| 0.00 | 2.27 | 0.00 | 1.30 | -18.63 | 147.42 | 17.51 | 214.85 | 0.5009 | -882.0 | -767.2 | |
| 0.00 | 1.22 | 0.00 | 0.72 | -22.20 | 147.64 | 17.73 | 211.21 | 0.5462 | 630.0 | 512.3 | |
| 0.79 | -6.00 | 0.46 | -6.00 | -22.37 | 147.49 | 17.58 | 210.83 | 0.5471 | 576.6 | 999999 | |
| 14.85 | -6.00 | 8.62 | -6.00 | -20.90 | 146.88 | 16.96 | 211.46 | 0.5243 | -1144.9 | 999999 | |
| 2.18 | -6.00 | 1.27 | -6.00 | -21.36 | 146.70 | 16.78 | 210.70 | 0.5287 | 660.6 | 999999 | |
| 0.35 | -6.00 | 0.21 | -6.00 | -22.41 | 146.79 | 16.87 | 209.78 | 0.5424 | -430.0 | 999999 | |
| 0.00 | 0.96 | 0.00 | 0.57 | -23.64 | 146.95 | 17.03 | 208.82 | 0.5588 | 698.0 | 585.6 | |
| 0.00 | 2.62 | 0.00 | 1.54 | -22.43 | 146.45 | 16.54 | 209.27 | 0.5403 | -649.0 | -444.0 | |
| 0.00 | 1.22 | 0.00 | 0.71 | -21.12 | 145.43 | 15.52 | 209.03 | 0.5163 | 833.0 | 628.2 | |
| 0.00 | 1.14 | 0.00 | 0.66 | -21.29 | 145.38 | 15.47 | 208.79 | 0.5180 | 672.0 | 511.6 | |
| 1.48 | 5.15 | 0.87 | 3.01 | -22.49 | 145.12 | 15.20 | 207.22 | 0.5317 | -850.8 | -667.6 | |
| 0.00 | 0.87 | 0.00 | 0.52 | -24.10 | 145.27 | 15.35 | 206.00 | 0.5535 | 607.0 | 552.1 | |
| 0.00 | 1.05 | 0.00 | 0.61 | -22.55 | 144.89 | 14.97 | 206.81 | 0.5310 | -647.0 | -485.6 | |
| 0.00 | 0.87 | 0.00 | 0.50 | -20.01 | 143.81 | 13.89 | 207.53 | 0.4901 | -797.0 | -669.8 | |
| 1.22 | 3.49 | 0.70 | 1.99 | -20.27 | 143.73 | 13.81 | 207.14 | 0.4931 | -829.8 | -640.2 | |
| 0.00 | 2.97 | 0.00 | 1.71 | -21.57 | 143.62 | 13.70 | 205.72 | 0.5097 | -864.0 | -755.9 | |
| 0.00 | 0.87 | 0.00 | 0.50 | -20.26 | 143.44 | 13.52 | 206.65 | 0.4909 | -799.0 | -693.6 | |
| 0.00 | 1.48 | 0.00 | 0.84 | -20.32 | 143.21 | 13.29 | 206.21 | 0.4902 | -767.0 | -553.1 | |
| 0.00 | 1.75 | 0.00 | 0.99 | -20.38 | 142.95 | 13.04 | 205.72 | 0.4893 | -959.0 | -812.7 | |
| 0.00 | 1.57 | 0.00 | 0.92 | -23.60 | 143.06 | 13.14 | 203.09 | 0.5333 | -787.0 | -636.9 | |
| 0.00 | 1.83 | 0.00 | 1.07 | -23.47 | 141.97 | 12.06 | 201.47 | 0.5255 | -806.0 | -622.9 | |
| 0.00 | 1.75 | 0.00 | 1.01 | -23.31 | 141.36 | 11.44 | 200.59 | 0.5201 | -744.0 | -523.7 | |
| 0.00 | 0.96 | 0.00 | 0.54 | -20.93 | 140.65 | 10.73 | 201.20 | 0.4829 | -815.0 | -685.2 | |
| 0.00 | 1.83 | 0.00 | 1.09 | -26.25 | 140.72 | 10.80 | 197.62 | 0.5576 | 784.0 | 646.1 | |
| 0.00 | 2.27 | 0.00 | 1.28 | -21.55 | 138.22 | 8.30 | 196.31 | 0.4800 | -875.0 | -635.7 | |
| 0.00 | 1.14 | 0.00 | 0.66 | -24.70 | 138.01 | 8.09 | 194.17 | 0.5248 | -563.0 | -474.4 | |
| 0.00 | 1.22 | 0.00 | 0.71 | -25.18 | 137.61 | 7.69 | 193.26 | 0.5303 | -616.0 | -490.7 | |
| Proj. U | - Projected umbra area in millionths of solar disc, negative values indicate | |
|
that the umbra consists of fragmented regions which cannot be separated without losing umbral area. In this way several spots (intensity minima in the umbra) have a common umbra, e.g. -2 means that the given spot shares an umbra with spot No.2, and the common U value is indicated at spot No.2. |
||
| Proj. WS | - Projected whole spot area in millionths of solar disc, negative values indicate | |
|
that several umbras have a common penumbra, e.g. -7 means that the given umbra shares a penumbra with umbra No.7, and the WS value is indicated at No.7. |
||
| Corr. U | - Corrected umbra area in millionths of solar hemisphere, for negative values see above | |
| Corr. WS | - Corrected whole spot area in millionths of solar hemisphere, for negative values see above | |
| B | - Heliographic latitude B; positive: North, negative: South | |
| L | - Heliographic longitude L | |
| LCM | - Longitudinal distance from the Sun's central meridian | |
| Pos. angle | - Position angle | |
| r | - Distance from the centre of Sun's disc in terms of Sun's radius | |
| MU | - Mean magnetic field within the umbra contour averaged the pixel values with sign. | |
| MP | - Mean magnetic field within the penumbra contour averaged the pixel values with sign. | |