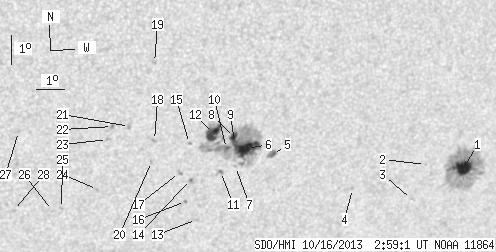
SDO HMI 2013-10-16 02:59:01 UT
See sunspots with tool (Click here to study sunspot positions and configurations with tool using white-light and magnetogram images and polarity drawing)
(It is recommended to set high resolution on your display!)
| group | Proj. U | Proj. WS | Corr. U | Corr. WS | B | L | LCM | Pos. angle | r | MU | MP |
| 73.90 | 302.76 | 46.83 | 194.30 | -21.86 | 151.16 | 28.41 | 223.89 | 0.6347 | 256.7 | 134.5 | |
|
previous
or next observation for the same group /
back to the solar disc SDO HMI 2013-10-16 02:59:01 UT
See sunspots with tool (Click here to study sunspot positions and configurations with tool using white-light and magnetogram images and polarity drawing) (It is recommended to set high resolution on your display!) |
| spot | Proj. U | Proj. WS | Corr. U | Corr. WS | B | L | LCM | Pos. angle | r | MU | MP |
| 18.52 | 116.52 | 12.66 | 79.73 | -22.56 | 156.56 | 33.81 | 228.22 | 0.6914 | 1045.2 | 316.0 | |
| 0.00 | 0.52 | 0.00 | 0.35 | -22.37 | 155.04 | 32.29 | 227.20 | 0.6756 | 593.0 | 559.5 | |
| 0.00 | 0.35 | 0.00 | 0.24 | -23.54 | 154.81 | 32.06 | 225.65 | 0.6829 | 574.0 | 517.8 | |
| 0.00 | 0.79 | 0.00 | 0.52 | -23.03 | 152.44 | 29.69 | 224.13 | 0.6570 | 674.0 | 617.0 | |
| 2.71 | 5.33 | 1.70 | 3.34 | -21.72 | 149.21 | 26.47 | 222.49 | 0.6153 | 777.7 | 597.4 | |
| 28.39 | 149.02 | 17.60 | 91.86 | -21.47 | 148.24 | 25.49 | 221.74 | 0.6038 | 907.9 | 15.2 | |
| 0.00 | 1.14 | 0.00 | 0.71 | -22.06 | 147.96 | 25.21 | 220.74 | 0.6071 | 531.0 | 465.8 | |
| 5.50 | -6.00 | 3.38 | -6.00 | -21.08 | 147.74 | 24.99 | 221.66 | 0.5953 | -795.3 | 999999 | |
| 1.14 | -6.00 | 0.70 | -6.00 | -21.24 | 147.77 | 25.02 | 221.49 | 0.5973 | 458.7 | 999999 | |
| 2.36 | -6.00 | 1.45 | -6.00 | -21.43 | 147.52 | 24.77 | 220.99 | 0.5969 | 682.0 | 999999 | |
| 0.52 | 3.23 | 0.33 | 2.00 | -22.20 | 147.45 | 24.70 | 220.01 | 0.6040 | 654.7 | 465.4 | |
| 14.41 | -6.00 | 8.79 | -6.00 | -20.91 | 146.97 | 24.22 | 220.99 | 0.5865 | -945.9 | 999999 | |
| 0.00 | 1.31 | 0.00 | 0.82 | -23.81 | 146.90 | 24.15 | 217.61 | 0.6156 | 419.0 | 489.6 | |
| 0.35 | 2.10 | 0.22 | 1.29 | -22.43 | 146.43 | 23.68 | 218.60 | 0.5972 | -582.0 | -288.7 | |
| 0.00 | 1.14 | 0.00 | 0.69 | -21.21 | 146.18 | 23.43 | 219.72 | 0.5823 | -586.0 | -502.1 | |
| 0.00 | 1.31 | 0.00 | 0.81 | -23.17 | 146.39 | 23.64 | 217.72 | 0.6047 | -420.0 | -359.3 | |
| 0.00 | 2.53 | 0.00 | 1.55 | -22.17 | 145.99 | 23.24 | 218.38 | 0.5908 | -740.0 | -582.5 | |
| 0.00 | 1.75 | 0.00 | 1.05 | -21.05 | 144.93 | 22.19 | 218.40 | 0.5695 | 734.0 | 647.1 | |
| 0.00 | 1.83 | 0.00 | 1.08 | -18.46 | 144.56 | 21.81 | 221.11 | 0.5381 | -598.0 | -570.1 | |
| 0.00 | 1.66 | 0.00 | 1.00 | -21.76 | 144.94 | 22.19 | 217.60 | 0.5772 | 757.0 | 589.8 | |
| 0.00 | 2.62 | 0.00 | 1.56 | -20.55 | 144.00 | 21.25 | 217.82 | 0.5556 | -781.0 | -614.5 | |
| 0.00 | 1.75 | 0.00 | 1.03 | -20.52 | 143.41 | 20.66 | 217.08 | 0.5502 | -825.0 | -654.2 | |
| 0.00 | 1.40 | 0.00 | 0.83 | -20.95 | 143.30 | 20.55 | 216.44 | 0.5541 | -736.0 | -563.7 | |
| 0.00 | 0.96 | 0.00 | 0.58 | -22.63 | 143.21 | 20.46 | 214.46 | 0.5724 | -605.0 | -530.1 | |
| 0.00 | 1.22 | 0.00 | 0.74 | -23.24 | 142.06 | 19.31 | 212.33 | 0.5703 | -649.0 | -558.7 | |
| 0.00 | 0.79 | 0.00 | 0.47 | -23.29 | 141.76 | 19.01 | 211.87 | 0.5687 | -476.0 | -455.7 | |
| 0.00 | 1.66 | 0.00 | 0.96 | -20.57 | 140.24 | 17.49 | 212.62 | 0.5242 | -769.0 | -639.1 | |
| 0.00 | 1.83 | 0.00 | 1.09 | -23.25 | 140.41 | 17.66 | 210.09 | 0.5581 | -687.0 | -495.0 | |
| Proj. U | - Projected umbra area in millionths of solar disc, negative values indicate | |
|
that the umbra consists of fragmented regions which cannot be separated without losing umbral area. In this way several spots (intensity minima in the umbra) have a common umbra, e.g. -2 means that the given spot shares an umbra with spot No.2, and the common U value is indicated at spot No.2. |
||
| Proj. WS | - Projected whole spot area in millionths of solar disc, negative values indicate | |
|
that several umbras have a common penumbra, e.g. -7 means that the given umbra shares a penumbra with umbra No.7, and the WS value is indicated at No.7. |
||
| Corr. U | - Corrected umbra area in millionths of solar hemisphere, for negative values see above | |
| Corr. WS | - Corrected whole spot area in millionths of solar hemisphere, for negative values see above | |
| B | - Heliographic latitude B; positive: North, negative: South | |
| L | - Heliographic longitude L | |
| LCM | - Longitudinal distance from the Sun's central meridian | |
| Pos. angle | - Position angle | |
| r | - Distance from the centre of Sun's disc in terms of Sun's radius | |
| MU | - Mean magnetic field within the umbra contour averaged the pixel values with sign. | |
| MP | - Mean magnetic field within the penumbra contour averaged the pixel values with sign. | |