SDO HMI 2013-10-16 11:59:00 UT
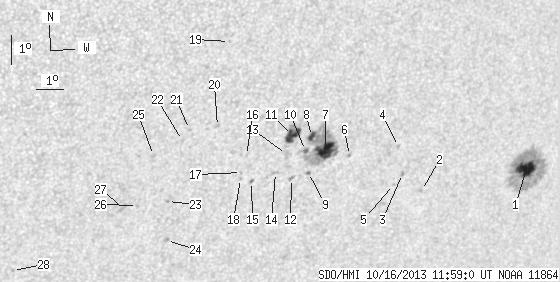
See sunspots with tool (Click here to study sunspot positions and configurations with tool using white-light and magnetogram images and polarity drawing)
(It is recommended to set high resolution on your display!)
| group | Proj. U | Proj. WS | Corr. U | Corr. WS | B | L | LCM | Pos. angle | r | MU | MP |
| 55.08 | 254.48 | 37.14 | 173.61 | -21.95 | 151.69 | 33.87 | 228.68 | 0.6865 | 166.1 | 106.3 | |
|
previous
or next observation for the same group /
back to the solar disc SDO HMI 2013-10-16 11:59:00 UT
See sunspots with tool (Click here to study sunspot positions and configurations with tool using white-light and magnetogram images and polarity drawing) (It is recommended to set high resolution on your display!) |
| spot | Proj. U | Proj. WS | Corr. U | Corr. WS | B | L | LCM | Pos. angle | r | MU | MP |
| 18.68 | 112.10 | 13.64 | 81.91 | -22.50 | 156.56 | 38.73 | 231.92 | 0.7367 | 981.8 | 252.6 | |
| 0.00 | 0.87 | 0.00 | 0.61 | -22.98 | 152.45 | 34.63 | 228.41 | 0.7018 | 678.0 | 545.2 | |
| 0.00 | 1.83 | 0.00 | 1.25 | -22.35 | 151.53 | 33.70 | 228.42 | 0.6884 | 754.0 | 636.5 | |
| 0.00 | 1.57 | 0.00 | 1.06 | -21.42 | 151.12 | 33.30 | 229.20 | 0.6776 | -593.0 | -456.3 | |
| 0.00 | 1.05 | 0.00 | 0.71 | -22.71 | 151.27 | 33.45 | 227.80 | 0.6888 | 617.0 | 508.1 | |
| 0.00 | 0.61 | 0.00 | 0.40 | -21.62 | 149.31 | 31.48 | 227.43 | 0.6615 | 638.0 | 566.0 | |
| 18.60 | 85.91 | 12.10 | 55.69 | -21.40 | 148.35 | 30.53 | 226.86 | 0.6505 | 831.2 | 87.0 | |
| 3.84 | -7.00 | 2.47 | -7.00 | -20.89 | 147.72 | 29.90 | 226.89 | 0.6401 | -845.4 | 999999 | |
| 0.52 | 1.75 | 0.34 | 1.14 | -22.11 | 147.88 | 30.06 | 225.58 | 0.6520 | 566.5 | 483.5 | |
| 1.22 | -7.00 | 0.79 | -7.00 | -21.35 | 147.60 | 29.78 | 226.22 | 0.6429 | 710.8 | 999999 | |
| 12.22 | 18.16 | 7.80 | 11.58 | -20.82 | 147.00 | 29.18 | 226.31 | 0.6325 | -970.2 | -598.9 | |
| 0.00 | 2.18 | 0.00 | 1.42 | -22.28 | 147.29 | 29.47 | 224.83 | 0.6479 | 648.0 | 500.7 | |
| 0.00 | 4.71 | 0.00 | 3.02 | -21.45 | 146.92 | 29.10 | 225.47 | 0.6372 | 214.0 | 228.4 | |
| 0.00 | 2.88 | 0.00 | 1.85 | -22.04 | 146.64 | 28.82 | 224.50 | 0.6398 | -417.0 | -292.8 | |
| 0.00 | 1.57 | 0.00 | 1.00 | -22.30 | 145.82 | 28.00 | 223.39 | 0.6344 | -509.0 | -472.7 | |
| 0.00 | 0.52 | 0.00 | 0.33 | -21.41 | 145.45 | 27.62 | 224.08 | 0.6228 | 317.0 | 422.8 | |
| 0.00 | 1.05 | 0.00 | 0.66 | -21.98 | 145.38 | 27.56 | 223.34 | 0.6274 | -619.0 | -457.4 | |
| 0.00 | 0.79 | 0.00 | 0.50 | -22.18 | 145.39 | 27.57 | 223.11 | 0.6293 | -693.0 | -607.2 | |
| 0.00 | 0.70 | 0.00 | 0.42 | -17.59 | 144.15 | 26.33 | 227.59 | 0.5748 | -449.0 | -395.9 | |
| 0.00 | 2.18 | 0.00 | 1.35 | -20.38 | 144.21 | 26.38 | 224.05 | 0.6013 | -631.0 | -472.4 | |
| 0.00 | 1.05 | 0.00 | 0.64 | -20.43 | 143.22 | 25.40 | 222.93 | 0.5924 | -639.0 | -606.1 | |
| 0.00 | 1.22 | 0.00 | 0.75 | -20.79 | 143.04 | 25.21 | 222.29 | 0.5941 | -705.0 | -576.1 | |
| 0.00 | 0.96 | 0.00 | 0.60 | -22.83 | 142.89 | 25.06 | 219.73 | 0.6130 | -716.0 | -624.8 | |
| 0.00 | 2.18 | 0.00 | 1.39 | -24.18 | 143.13 | 25.30 | 218.51 | 0.6285 | -648.0 | -535.3 | |
| 0.00 | 1.83 | 0.00 | 1.12 | -21.25 | 142.10 | 24.27 | 220.68 | 0.5899 | -620.0 | -549.5 | |
| 0.00 | 1.22 | 0.00 | 0.76 | -22.92 | 141.83 | 24.01 | 218.46 | 0.6047 | -663.0 | -554.6 | |
| 0.00 | 4.37 | 0.00 | 2.70 | -22.97 | 141.31 | 23.48 | 217.81 | 0.6007 | -478.0 | -512.6 | |
| 0.00 | 1.22 | 0.00 | 0.75 | -24.99 | 137.79 | 19.96 | 211.47 | 0.5950 | -610.0 | -462.7 | |
| Proj. U | - Projected umbra area in millionths of solar disc, negative values indicate | |
|
that the umbra consists of fragmented regions which cannot be separated without losing umbral area. In this way several spots (intensity minima in the umbra) have a common umbra, e.g. -2 means that the given spot shares an umbra with spot No.2, and the common U value is indicated at spot No.2. |
||
| Proj. WS | - Projected whole spot area in millionths of solar disc, negative values indicate | |
|
that several umbras have a common penumbra, e.g. -7 means that the given umbra shares a penumbra with umbra No.7, and the WS value is indicated at No.7. |
||
| Corr. U | - Corrected umbra area in millionths of solar hemisphere, for negative values see above | |
| Corr. WS | - Corrected whole spot area in millionths of solar hemisphere, for negative values see above | |
| B | - Heliographic latitude B; positive: North, negative: South | |
| L | - Heliographic longitude L | |
| LCM | - Longitudinal distance from the Sun's central meridian | |
| Pos. angle | - Position angle | |
| r | - Distance from the centre of Sun's disc in terms of Sun's radius | |
| MU | - Mean magnetic field within the umbra contour averaged the pixel values with sign. | |
| MP | - Mean magnetic field within the penumbra contour averaged the pixel values with sign. | |