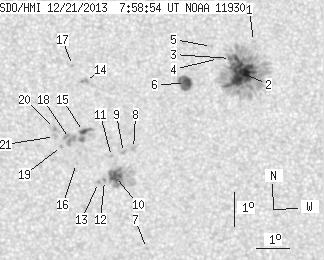
SDO HMI 2013-12-21 07:58:54 UT
See sunspots with tool (Click here to study sunspot positions and configurations with tool using white-light and magnetogram images and polarity drawing)
(It is recommended to set high resolution on your display!)
| group | Proj. U | Proj. WS | Corr. U | Corr. WS | B | L | LCM | Pos. angle | r | MU | MP |
| 64.14 | 270.18 | 32.13 | 135.47 | -9.87 | 326.82 | -3.19 | 160.49 | 0.1545 | 390.3 | 77.8 | |
|
previous
or next observation for the same group /
back to the solar disc SDO HMI 2013-12-21 07:58:54 UT
See sunspots with tool (Click here to study sunspot positions and configurations with tool using white-light and magnetogram images and polarity drawing) (It is recommended to set high resolution on your display!) |
| spot | Proj. U | Proj. WS | Corr. U | Corr. WS | B | L | LCM | Pos. angle | r | MU | MP |
| 0.00 | 1.02 | 0.00 | 0.51 | -8.17 | 328.62 | -1.39 | 167.97 | 0.1154 | 926.0 | 676.2 | |
| 41.08 | 169.19 | 20.53 | 84.54 | -9.09 | 328.23 | -1.78 | 166.56 | 0.1325 | 1258.8 | 422.7 | |
| 1.28 | -2.00 | 0.64 | -2.00 | -8.68 | 327.93 | -2.07 | 163.53 | 0.1269 | 752.4 | 999999 | |
| 0.00 | 1.53 | 0.00 | 0.76 | -8.68 | 327.57 | -2.43 | 160.89 | 0.1288 | 932.0 | 706.2 | |
| 0.00 | 1.02 | 0.00 | 0.51 | -8.32 | 327.37 | -2.64 | 158.37 | 0.1242 | -630.0 | -456.1 | |
| 10.80 | 14.63 | 5.41 | 7.32 | -9.42 | 326.58 | -3.43 | 156.24 | 0.1470 | 1138.8 | 816.9 | |
| 0.00 | 1.11 | 0.00 | 0.56 | -14.36 | 325.32 | -4.69 | 160.12 | 0.2338 | 758.0 | 575.1 | |
| 0.00 | 2.47 | 0.00 | 1.24 | -11.35 | 324.99 | -5.02 | 152.87 | 0.1889 | -964.0 | -760.9 | |
| 0.00 | 2.13 | 0.00 | 1.07 | -11.47 | 324.68 | -5.32 | 151.78 | 0.1932 | -981.0 | -820.6 | |
| 8.85 | 41.77 | 4.48 | 21.13 | -12.19 | 324.42 | -5.58 | 152.39 | 0.2061 | -1172.2 | -500.6 | |
| 0.00 | 1.70 | 0.00 | 0.86 | -11.59 | 324.32 | -5.69 | 150.48 | 0.1980 | -1008.0 | -749.1 | |
| 0.00 | 1.28 | 0.00 | 0.65 | -12.30 | 324.09 | -5.92 | 151.28 | 0.2106 | -944.0 | -806.7 | |
| 0.00 | 1.70 | 0.00 | 0.86 | -12.36 | 323.90 | -6.10 | 150.68 | 0.2130 | -732.0 | -605.7 | |
| 0.00 | 3.23 | 0.00 | 1.63 | -9.34 | 323.58 | -6.42 | 140.27 | 0.1736 | 1047.0 | 866.5 | |
| 2.13 | 11.06 | 1.07 | 5.58 | -10.83 | 323.49 | -6.52 | 144.89 | 0.1947 | -1159.0 | -766.4 | |
| 0.00 | 0.94 | 0.00 | 0.47 | -11.79 | 323.25 | -6.75 | 146.67 | 0.2105 | -871.0 | -689.3 | |
| 0.00 | 1.02 | 0.00 | 0.51 | -8.87 | 323.20 | -6.81 | 136.78 | 0.1718 | -936.0 | -740.6 | |
| 0.00 | 9.36 | 0.00 | 4.73 | -11.04 | 323.06 | -6.95 | 143.80 | 0.2019 | -1064.0 | -982.0 | |
| 0.00 | 0.85 | 0.00 | 0.43 | -11.28 | 322.81 | -7.19 | 143.55 | 0.2077 | -961.0 | -800.5 | |
| 0.00 | 1.70 | 0.00 | 0.86 | -10.74 | 322.61 | -7.39 | 141.17 | 0.2025 | -1046.0 | -918.4 | |
| 0.00 | 2.47 | 0.00 | 1.25 | -10.98 | 322.61 | -7.40 | 141.89 | 0.2058 | -734.0 | -719.6 | |
| Proj. U | - Projected umbra area in millionths of solar disc, negative values indicate | |
|
that the umbra consists of fragmented regions which cannot be separated without losing umbral area. In this way several spots (intensity minima in the umbra) have a common umbra, e.g. -2 means that the given spot shares an umbra with spot No.2, and the common U value is indicated at spot No.2. |
||
| Proj. WS | - Projected whole spot area in millionths of solar disc, negative values indicate | |
|
that several umbras have a common penumbra, e.g. -7 means that the given umbra shares a penumbra with umbra No.7, and the WS value is indicated at No.7. |
||
| Corr. U | - Corrected umbra area in millionths of solar hemisphere, for negative values see above | |
| Corr. WS | - Corrected whole spot area in millionths of solar hemisphere, for negative values see above | |
| B | - Heliographic latitude B; positive: North, negative: South | |
| L | - Heliographic longitude L | |
| LCM | - Longitudinal distance from the Sun's central meridian | |
| Pos. angle | - Position angle | |
| r | - Distance from the centre of Sun's disc in terms of Sun's radius | |
| MU | - Mean magnetic field within the umbra contour averaged the pixel values with sign. | |
| MP | - Mean magnetic field within the penumbra contour averaged the pixel values with sign. | |