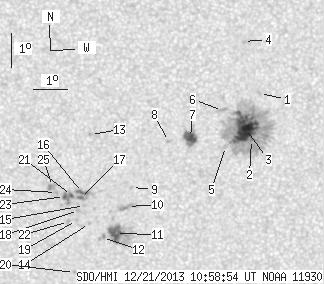
SDO HMI 2013-12-21 10:58:54 UT
See sunspots with tool (Click here to study sunspot positions and configurations with tool using white-light and magnetogram images and polarity drawing)
(It is recommended to set high resolution on your display!)
| group | Proj. U | Proj. WS | Corr. U | Corr. WS | B | L | LCM | Pos. angle | r | MU | MP |
| 66.77 | 286.88 | 33.43 | 143.67 | -9.80 | 326.95 | -1.42 | 172.12 | 0.1461 | 283.1 | 95.9 | |
|
previous
or next observation for the same group /
back to the solar disc SDO HMI 2013-12-21 10:58:54 UT
See sunspots with tool (Click here to study sunspot positions and configurations with tool using white-light and magnetogram images and polarity drawing) (It is recommended to set high resolution on your display!) |
| spot | Proj. U | Proj. WS | Corr. U | Corr. WS | B | L | LCM | Pos. angle | r | MU | MP |
| 0.00 | 1.53 | 0.00 | 0.76 | -8.04 | 328.77 | 0.40 | 183.58 | 0.1106 | 800.0 | 654.9 | |
| 1.02 | 177.92 | 0.51 | 88.86 | -9.40 | 328.53 | 0.16 | 181.17 | 0.1342 | 899.1 | 404.8 | |
| 39.55 | -2.00 | 19.75 | -2.00 | -9.07 | 328.35 | -0.02 | 179.84 | 0.1284 | 1280.7 | 999999 | |
| 0.00 | 1.53 | 0.00 | 0.76 | -6.50 | 328.29 | -0.08 | 179.08 | 0.0835 | 675.0 | 618.7 | |
| 0.00 | 2.30 | 0.00 | 1.15 | -9.61 | 327.75 | -0.62 | 175.55 | 0.1381 | 235.0 | 168.2 | |
| 0.00 | 4.17 | 0.00 | 2.08 | -8.54 | 327.66 | -0.71 | 174.14 | 0.1197 | 767.0 | 601.2 | |
| 9.36 | 16.58 | 4.68 | 8.29 | -9.34 | 326.70 | -1.66 | 167.79 | 0.1361 | 1133.0 | 521.7 | |
| 0.00 | 1.62 | 0.00 | 0.81 | -9.46 | 326.04 | -2.32 | 163.44 | 0.1410 | 950.0 | 640.2 | |
| 0.00 | 1.02 | 0.00 | 0.51 | -10.83 | 324.92 | -3.45 | 159.52 | 0.1696 | -820.0 | -602.1 | |
| 0.00 | 8.08 | 0.00 | 4.07 | -11.39 | 324.79 | -3.57 | 160.00 | 0.1795 | -1020.0 | -787.5 | |
| 11.14 | 31.04 | 5.62 | 15.67 | -12.20 | 324.42 | -3.95 | 159.68 | 0.1947 | -1132.2 | -502.6 | |
| 0.00 | 3.23 | 0.00 | 1.63 | -12.32 | 324.02 | -4.34 | 158.07 | 0.1991 | -858.0 | -703.7 | |
| 0.00 | 1.02 | 0.00 | 0.51 | -9.24 | 323.71 | -4.66 | 148.52 | 0.1541 | 926.0 | 753.6 | |
| 0.00 | 1.28 | 0.00 | 0.64 | -11.90 | 323.64 | -4.73 | 155.45 | 0.1951 | -859.0 | -625.1 | |
| 0.00 | 0.94 | 0.00 | 0.47 | -11.36 | 323.50 | -4.87 | 153.56 | 0.1878 | -994.0 | -840.3 | |
| 2.38 | 22.03 | 1.20 | 11.10 | -10.97 | 323.44 | -4.92 | 152.33 | 0.1823 | -1187.1 | -844.4 | |
| 0.94 | -16.00 | 0.47 | -16.00 | -11.12 | 323.38 | -4.99 | 152.41 | 0.1850 | -1134.2 | 999999 | |
| 0.00 | 2.04 | 0.00 | 1.03 | -11.51 | 323.31 | -5.05 | 153.07 | 0.1915 | -851.0 | -739.3 | |
| 0.00 | 1.02 | 0.00 | 0.52 | -11.81 | 323.25 | -5.12 | 153.48 | 0.1966 | -874.0 | -712.7 | |
| 0.00 | 1.02 | 0.00 | 0.52 | -13.37 | 323.15 | -5.21 | 156.34 | 0.2214 | -849.0 | -601.8 | |
| 1.19 | -16.00 | 0.60 | -16.00 | -11.06 | 323.11 | -5.26 | 151.00 | 0.1863 | -1154.4 | 999999 | |
| 0.00 | 1.87 | 0.00 | 0.95 | -11.84 | 323.00 | -5.36 | 152.48 | 0.1989 | -792.0 | -625.9 | |
| 1.19 | -16.00 | 0.60 | -16.00 | -11.09 | 322.90 | -5.47 | 150.11 | 0.1885 | -1099.9 | 999999 | |
| 0.00 | 1.28 | 0.00 | 0.64 | -10.97 | 322.66 | -5.71 | 148.71 | 0.1889 | -1165.0 | -951.0 | |
| 0.00 | 5.36 | 0.00 | 2.70 | -10.79 | 322.54 | -5.82 | 147.68 | 0.1873 | -959.0 | -849.9 | |
| Proj. U | - Projected umbra area in millionths of solar disc, negative values indicate | |
|
that the umbra consists of fragmented regions which cannot be separated without losing umbral area. In this way several spots (intensity minima in the umbra) have a common umbra, e.g. -2 means that the given spot shares an umbra with spot No.2, and the common U value is indicated at spot No.2. |
||
| Proj. WS | - Projected whole spot area in millionths of solar disc, negative values indicate | |
|
that several umbras have a common penumbra, e.g. -7 means that the given umbra shares a penumbra with umbra No.7, and the WS value is indicated at No.7. |
||
| Corr. U | - Corrected umbra area in millionths of solar hemisphere, for negative values see above | |
| Corr. WS | - Corrected whole spot area in millionths of solar hemisphere, for negative values see above | |
| B | - Heliographic latitude B; positive: North, negative: South | |
| L | - Heliographic longitude L | |
| LCM | - Longitudinal distance from the Sun's central meridian | |
| Pos. angle | - Position angle | |
| r | - Distance from the centre of Sun's disc in terms of Sun's radius | |
| MU | - Mean magnetic field within the umbra contour averaged the pixel values with sign. | |
| MP | - Mean magnetic field within the penumbra contour averaged the pixel values with sign. | |