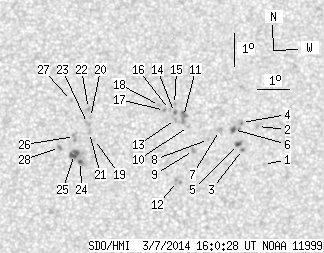
SDO HMI 2014-03-07 16:00:28 UT
See sunspots with tool (Click here to study sunspot positions and configurations with tool using white-light and magnetogram images and polarity drawing)
(It is recommended to set high resolution on your display!)
| group | Proj. U | Proj. WS | Corr. U | Corr. WS | B | L | LCM | Pos. angle | r | MU | MP |
| 6.30 | 68.34 | 3.18 | 34.31 | -16.35 | 45.25 | 0.50 | 183.01 | 0.1630 | 81.0 | 136.2 | |
|
previous
or next observation for the same group /
back to the solar disc SDO HMI 2014-03-07 16:00:28 UT
See sunspots with tool (Click here to study sunspot positions and configurations with tool using white-light and magnetogram images and polarity drawing) (It is recommended to set high resolution on your display!) |
| spot | Proj. U | Proj. WS | Corr. U | Corr. WS | B | L | LCM | Pos. angle | r | MU | MP |
| 0.00 | 1.04 | 0.00 | 0.52 | -17.19 | 48.72 | 3.97 | 200.91 | 0.1861 | -684.0 | -523.6 | |
| 0.00 | 1.12 | 0.00 | 0.56 | -16.04 | 48.51 | 3.76 | 202.35 | 0.1665 | -954.0 | -713.4 | |
| 0.00 | 1.47 | 0.00 | 0.74 | -16.74 | 48.06 | 3.31 | 198.48 | 0.1750 | 865.0 | 732.6 | |
| 0.00 | 2.42 | 0.00 | 1.22 | -15.93 | 48.01 | 3.26 | 199.89 | 0.1616 | 858.0 | 703.1 | |
| 1.12 | 2.42 | 0.57 | 1.22 | -16.59 | 47.93 | 3.18 | 198.10 | 0.1719 | 1148.5 | 985.1 | |
| 1.12 | 4.07 | 0.56 | 2.04 | -16.14 | 47.77 | 3.02 | 198.08 | 0.1636 | 1147.7 | 681.9 | |
| 0.00 | 3.63 | 0.00 | 1.82 | -16.17 | 47.34 | 2.58 | 195.57 | 0.1620 | 948.0 | 752.6 | |
| 0.00 | 0.87 | 0.00 | 0.43 | -16.44 | 47.00 | 2.25 | 193.22 | 0.1651 | 858.0 | 669.6 | |
| 0.00 | 2.60 | 0.00 | 1.30 | -16.78 | 46.54 | 1.78 | 190.19 | 0.1692 | 1005.0 | 808.5 | |
| 0.00 | 1.04 | 0.00 | 0.52 | -16.05 | 46.38 | 1.62 | 190.07 | 0.1564 | 886.0 | 706.2 | |
| 0.00 | 6.40 | 0.00 | 3.21 | -15.75 | 46.22 | 1.47 | 189.44 | 0.1508 | 1227.0 | 942.4 | |
| 0.00 | 4.84 | 0.00 | 2.44 | -17.71 | 46.04 | 1.29 | 186.74 | 0.1839 | 800.0 | 717.2 | |
| 0.00 | 1.21 | 0.00 | 0.61 | -15.84 | 45.97 | 1.22 | 187.79 | 0.1517 | 989.0 | 779.9 | |
| 0.00 | 2.25 | 0.00 | 1.13 | -15.63 | 45.94 | 1.19 | 187.79 | 0.1480 | 1079.0 | 919.8 | |
| 0.00 | 0.95 | 0.00 | 0.48 | -15.39 | 45.94 | 1.19 | 188.01 | 0.1439 | 958.0 | 817.0 | |
| 0.00 | 1.38 | 0.00 | 0.69 | -15.54 | 45.79 | 1.03 | 186.86 | 0.1461 | 974.0 | 706.8 | |
| 0.00 | 1.30 | 0.00 | 0.65 | -15.57 | 45.63 | 0.88 | 185.82 | 0.1464 | 1003.0 | 923.2 | |
| 0.00 | 1.56 | 0.00 | 0.78 | -15.42 | 45.48 | 0.72 | 184.89 | 0.1435 | 1008.0 | 753.3 | |
| 0.00 | 1.21 | 0.00 | 0.61 | -16.44 | 43.46 | -1.29 | 172.32 | 0.1621 | -770.0 | -576.1 | |
| 0.00 | 0.78 | 0.00 | 0.39 | -15.78 | 43.35 | -1.41 | 170.96 | 0.1511 | -981.0 | -814.3 | |
| 0.00 | 1.82 | 0.00 | 0.91 | -16.23 | 43.31 | -1.44 | 171.21 | 0.1589 | -878.0 | -700.3 | |
| 0.00 | 1.30 | 0.00 | 0.65 | -15.51 | 43.29 | -1.47 | 170.27 | 0.1466 | -961.0 | -822.1 | |
| 0.00 | 3.11 | 0.00 | 1.56 | -15.96 | 43.25 | -1.50 | 170.57 | 0.1544 | -861.0 | -748.7 | |
| 0.69 | 12.37 | 0.35 | 6.22 | -17.10 | 43.02 | -1.73 | 170.44 | 0.1746 | -1034.8 | -859.4 | |
| 3.37 | -24.00 | 1.70 | -24.00 | -16.89 | 42.84 | -1.91 | 169.21 | 0.1715 | -1119.9 | 999999 | |
| 0.00 | 4.07 | 0.00 | 2.04 | -16.35 | 42.84 | -1.91 | 168.60 | 0.1623 | -1119.0 | -847.9 | |
| 0.00 | 1.21 | 0.00 | 0.61 | -15.27 | 42.76 | -1.99 | 166.52 | 0.1443 | -858.0 | -611.5 | |
| 0.00 | 1.90 | 0.00 | 0.96 | -16.68 | 42.38 | -2.38 | 166.39 | 0.1696 | -1107.0 | -904.0 | |
| Proj. U | - Projected umbra area in millionths of solar disc, negative values indicate | |
|
that the umbra consists of fragmented regions which cannot be separated without losing umbral area. In this way several spots (intensity minima in the umbra) have a common umbra, e.g. -2 means that the given spot shares an umbra with spot No.2, and the common U value is indicated at spot No.2. |
||
| Proj. WS | - Projected whole spot area in millionths of solar disc, negative values indicate | |
|
that several umbras have a common penumbra, e.g. -7 means that the given umbra shares a penumbra with umbra No.7, and the WS value is indicated at No.7. |
||
| Corr. U | - Corrected umbra area in millionths of solar hemisphere, for negative values see above | |
| Corr. WS | - Corrected whole spot area in millionths of solar hemisphere, for negative values see above | |
| B | - Heliographic latitude B; positive: North, negative: South | |
| L | - Heliographic longitude L | |
| LCM | - Longitudinal distance from the Sun's central meridian | |
| Pos. angle | - Position angle | |
| r | - Distance from the centre of Sun's disc in terms of Sun's radius | |
| MU | - Mean magnetic field within the umbra contour averaged the pixel values with sign. | |
| MP | - Mean magnetic field within the penumbra contour averaged the pixel values with sign. | |