SDO HMI 2014-03-14 08:11:44 UT
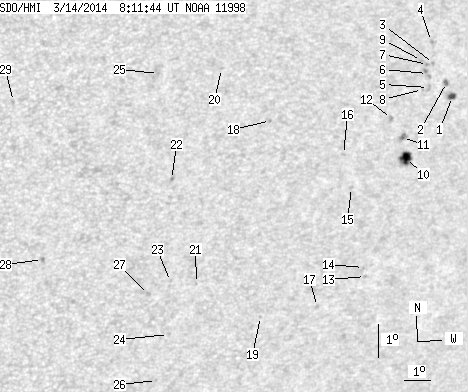
See sunspots with tool (Click here to study sunspot positions and configurations with tool using white-light and magnetogram images and polarity drawing)
(It is recommended to set high resolution on your display!)
| group | Proj. U | Proj. WS | Corr. U | Corr. WS | B | L | LCM | Pos. angle | r | MU | MP |
| 14.86 | 61.71 | 10.13 | 40.70 | -9.54 | 358.24 | 41.45 | 263.45 | 0.6586 | 306.8 | 268.3 | |
|
previous
or next observation for the same group /
back to the solar disc SDO HMI 2014-03-14 08:11:44 UT
See sunspots with tool (Click here to study sunspot positions and configurations with tool using white-light and magnetogram images and polarity drawing) (It is recommended to set high resolution on your display!) |
| spot | Proj. U | Proj. WS | Corr. U | Corr. WS | B | L | LCM | Pos. angle | r | MU | MP |
| 3.22 | 5.21 | 2.24 | 3.63 | -7.76 | 1.82 | 45.02 | 266.20 | 0.7048 | 675.7 | 444.0 | |
| 1.13 | 2.95 | 0.78 | 2.05 | -7.37 | 1.51 | 44.72 | 266.78 | 0.7012 | 728.9 | 584.8 | |
| 0.00 | 1.30 | 0.00 | 0.89 | -6.86 | 0.90 | 44.10 | 267.57 | 0.6940 | 602.0 | 550.4 | |
| 0.00 | 1.39 | 0.00 | 0.95 | -6.21 | 0.74 | 43.95 | 268.52 | 0.6925 | 519.0 | 512.1 | |
| 0.00 | 2.61 | 0.00 | 1.78 | -7.58 | 0.78 | 43.98 | 266.52 | 0.6920 | 488.0 | 549.4 | |
| 0.00 | 3.74 | 0.00 | 2.55 | -7.17 | 0.68 | 43.89 | 267.13 | 0.6911 | 571.0 | 631.9 | |
| 0.00 | 1.22 | 0.00 | 0.83 | -6.91 | 0.65 | 43.86 | 267.52 | 0.6908 | 725.0 | 672.1 | |
| 0.00 | 0.78 | 0.00 | 0.53 | -7.67 | 0.54 | 43.74 | 266.42 | 0.6889 | 676.0 | 631.1 | |
| 0.00 | 1.04 | 0.00 | 0.71 | -6.81 | 0.39 | 43.60 | 267.68 | 0.6876 | 767.0 | 630.2 | |
| 9.99 | 14.08 | 6.76 | 9.52 | -9.77 | 0.13 | 43.34 | 263.36 | 0.6832 | 816.2 | 417.4 | |
| 0.52 | 4.52 | 0.35 | 3.05 | -9.16 | 359.91 | 43.12 | 264.26 | 0.6805 | 830.8 | 611.6 | |
| 0.00 | 2.87 | 0.00 | 1.92 | -8.63 | 359.38 | 42.59 | 265.05 | 0.6739 | 690.0 | 551.1 | |
| 0.00 | 0.96 | 0.00 | 0.64 | -13.40 | 359.15 | 42.36 | 257.93 | 0.6725 | 589.0 | 507.9 | |
| 0.00 | 0.87 | 0.00 | 0.58 | -13.14 | 359.01 | 42.22 | 258.30 | 0.6706 | 675.0 | 627.8 | |
| 0.00 | 1.48 | 0.00 | 0.97 | -10.81 | 358.08 | 41.29 | 261.76 | 0.6572 | 279.0 | 239.2 | |
| 0.00 | 1.39 | 0.00 | 0.90 | -9.86 | 357.61 | 40.81 | 263.21 | 0.6508 | 665.0 | 508.2 | |
| 0.00 | 1.13 | 0.00 | 0.74 | -14.45 | 357.40 | 40.61 | 256.12 | 0.6516 | 550.0 | 438.0 | |
| 0.00 | 1.04 | 0.00 | 0.65 | -9.07 | 354.64 | 37.85 | 264.45 | 0.6110 | -565.0 | -496.8 | |
| 0.00 | 0.70 | 0.00 | 0.44 | -14.92 | 355.22 | 38.43 | 255.00 | 0.6240 | 628.0 | 523.0 | |
| 0.00 | 1.22 | 0.00 | 0.74 | -7.66 | 352.64 | 35.84 | 266.87 | 0.5834 | -367.0 | -293.5 | |
| 0.00 | 0.52 | 0.00 | 0.32 | -14.12 | 352.59 | 35.79 | 255.79 | 0.5873 | -457.0 | -504.3 | |
| 0.00 | 1.30 | 0.00 | 0.78 | -11.08 | 351.18 | 34.38 | 260.83 | 0.5636 | -664.0 | -596.5 | |
| 0.00 | 0.35 | 0.00 | 0.21 | -14.12 | 351.61 | 34.81 | 255.56 | 0.5739 | -597.0 | -549.5 | |
| 0.00 | 1.48 | 0.00 | 0.90 | -15.71 | 351.83 | 35.03 | 252.88 | 0.5804 | -293.0 | -314.2 | |
| 0.00 | 1.13 | 0.00 | 0.67 | -7.96 | 350.35 | 33.56 | 266.41 | 0.5507 | -571.0 | -477.2 | |
| 0.00 | 0.70 | 0.00 | 0.42 | -17.12 | 351.66 | 34.87 | 250.44 | 0.5820 | -434.0 | -381.6 | |
| 0.00 | 2.09 | 0.00 | 1.25 | -14.57 | 350.86 | 34.07 | 254.60 | 0.5646 | -607.0 | -508.6 | |
| 0.00 | 1.82 | 0.00 | 1.05 | -13.76 | 346.88 | 30.09 | 254.94 | 0.5063 | -833.0 | -703.3 | |
| 0.00 | 1.82 | 0.00 | 1.03 | -9.12 | 345.35 | 28.55 | 264.10 | 0.4764 | -673.0 | -432.7 | |
| Proj. U | - Projected umbra area in millionths of solar disc, negative values indicate | |
|
that the umbra consists of fragmented regions which cannot be separated without losing umbral area. In this way several spots (intensity minima in the umbra) have a common umbra, e.g. -2 means that the given spot shares an umbra with spot No.2, and the common U value is indicated at spot No.2. |
||
| Proj. WS | - Projected whole spot area in millionths of solar disc, negative values indicate | |
|
that several umbras have a common penumbra, e.g. -7 means that the given umbra shares a penumbra with umbra No.7, and the WS value is indicated at No.7. |
||
| Corr. U | - Corrected umbra area in millionths of solar hemisphere, for negative values see above | |
| Corr. WS | - Corrected whole spot area in millionths of solar hemisphere, for negative values see above | |
| B | - Heliographic latitude B; positive: North, negative: South | |
| L | - Heliographic longitude L | |
| LCM | - Longitudinal distance from the Sun's central meridian | |
| Pos. angle | - Position angle | |
| r | - Distance from the centre of Sun's disc in terms of Sun's radius | |
| MU | - Mean magnetic field within the umbra contour averaged the pixel values with sign. | |
| MP | - Mean magnetic field within the penumbra contour averaged the pixel values with sign. | |