SDO HMI 2014-03-19 09:01:15 UT
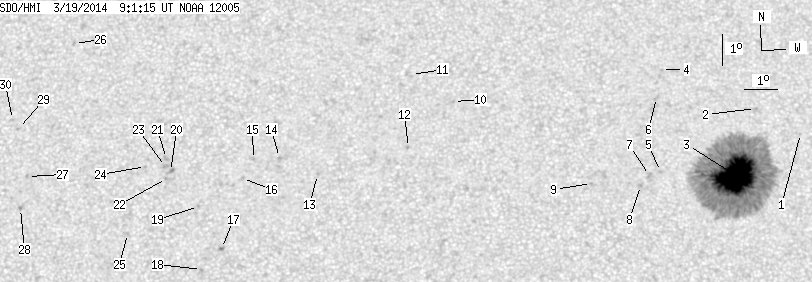
See sunspots with tool (Click here to study sunspot positions and configurations with tool using white-light and magnetogram images and polarity drawing)
(It is recommended to set high resolution on your display!)
| group | Proj. U | Proj. WS | Corr. U | Corr. WS | B | L | LCM | Pos. angle | r | MU | MP |
| 84.69 | 554.47 | 45.50 | 297.57 | 12.22 | 261.69 | 11.26 | 330.29 | 0.3864 | -842.7 | -375.4 | |
|
previous
or next observation for the same group /
back to the solar disc SDO HMI 2014-03-19 09:01:15 UT
See sunspots with tool (Click here to study sunspot positions and configurations with tool using white-light and magnetogram images and polarity drawing) (It is recommended to set high resolution on your display!) |
| spot | Proj. U | Proj. WS | Corr. U | Corr. WS | B | L | LCM | Pos. angle | r | MU | MP |
| 0.00 | 0.61 | 0.00 | 0.33 | 13.59 | 264.77 | 14.34 | 325.40 | 0.4257 | 699.0 | 455.4 | |
| 0.00 | 0.96 | 0.00 | 0.52 | 14.35 | 263.40 | 12.96 | 329.02 | 0.4240 | -597.0 | -475.2 | |
| 84.69 | 513.36 | 45.50 | 275.76 | 12.19 | 262.65 | 12.22 | 327.69 | 0.3887 | -1596.9 | -440.6 | |
| 0.00 | 0.78 | 0.00 | 0.43 | 15.53 | 260.50 | 10.06 | 336.24 | 0.4196 | -722.0 | -539.9 | |
| 0.00 | 1.22 | 0.00 | 0.65 | 12.27 | 260.32 | 9.89 | 333.00 | 0.3711 | -816.0 | -584.1 | |
| 0.00 | 2.09 | 0.00 | 1.13 | 14.62 | 260.30 | 9.86 | 335.74 | 0.4051 | -875.0 | -697.6 | |
| 0.00 | 2.70 | 0.00 | 1.44 | 12.13 | 259.97 | 9.54 | 333.65 | 0.3667 | -927.0 | -687.8 | |
| 0.00 | 1.22 | 0.00 | 0.65 | 11.81 | 259.68 | 9.25 | 333.95 | 0.3599 | -1007.0 | -844.9 | |
| 0.00 | 0.78 | 0.00 | 0.41 | 11.85 | 258.17 | 7.74 | 337.80 | 0.3504 | -915.0 | -723.7 | |
| 0.00 | 1.39 | 0.00 | 0.74 | 14.41 | 253.98 | 3.55 | 350.69 | 0.3723 | -614.0 | -452.1 | |
| 0.00 | 0.35 | 0.00 | 0.19 | 15.27 | 252.70 | 2.26 | 354.27 | 0.3835 | -462.0 | -546.8 | |
| 0.00 | 1.31 | 0.00 | 0.69 | 12.93 | 252.58 | 2.15 | 353.90 | 0.3453 | 686.0 | 572.7 | |
| 0.00 | 1.22 | 0.00 | 0.64 | 12.08 | 249.79 | -0.64 | 1.91 | 0.3295 | 813.0 | 638.2 | |
| 0.00 | 1.57 | 0.00 | 0.83 | 12.62 | 248.63 | -1.80 | 5.21 | 0.3396 | 768.0 | 610.8 | |
| 0.00 | 1.13 | 0.00 | 0.60 | 12.56 | 247.84 | -2.60 | 7.51 | 0.3401 | 824.0 | 553.8 | |
| 0.00 | 1.48 | 0.00 | 0.78 | 11.96 | 247.51 | -2.93 | 8.72 | 0.3311 | 832.0 | 672.2 | |
| 0.00 | 1.92 | 0.00 | 0.99 | 9.77 | 246.89 | -3.55 | 11.90 | 0.2970 | 1190.0 | 976.1 | |
| 0.00 | 1.39 | 0.00 | 0.72 | 9.12 | 246.29 | -4.15 | 14.38 | 0.2887 | 859.0 | 704.8 | |
| 0.00 | 0.96 | 0.00 | 0.50 | 11.09 | 246.17 | -4.26 | 13.18 | 0.3211 | 931.0 | 780.0 | |
| 0.00 | 3.05 | 0.00 | 1.61 | 12.21 | 245.30 | -5.13 | 14.87 | 0.3424 | 1063.0 | 818.9 | |
| 0.00 | 2.09 | 0.00 | 1.10 | 12.62 | 245.17 | -5.27 | 14.91 | 0.3495 | 690.0 | 654.3 | |
| 0.00 | 0.96 | 0.00 | 0.50 | 11.99 | 245.18 | -5.25 | 15.37 | 0.3394 | 958.0 | 750.9 | |
| 0.00 | 3.05 | 0.00 | 1.61 | 12.37 | 245.14 | -5.29 | 15.18 | 0.3456 | 776.0 | 715.6 | |
| 0.00 | 0.78 | 0.00 | 0.41 | 12.37 | 244.53 | -5.91 | 16.83 | 0.3485 | 809.0 | 637.0 | |
| 0.00 | 1.13 | 0.00 | 0.59 | 10.27 | 244.02 | -6.41 | 20.29 | 0.3183 | 983.0 | 727.3 | |
| 0.00 | 1.74 | 0.00 | 0.95 | 16.36 | 242.20 | -8.23 | 19.12 | 0.4212 | 554.0 | 442.4 | |
| 0.00 | 1.48 | 0.00 | 0.79 | 12.13 | 240.90 | -9.54 | 26.35 | 0.3665 | 792.0 | 665.8 | |
| 0.00 | 1.22 | 0.00 | 0.65 | 11.12 | 240.72 | -9.72 | 28.09 | 0.3533 | 965.0 | 820.1 | |
| 0.00 | 1.31 | 0.00 | 0.70 | 13.66 | 240.56 | -9.87 | 25.33 | 0.3912 | 905.0 | 626.1 | |
| 0.00 | 1.22 | 0.00 | 0.66 | 13.95 | 240.36 | -10.07 | 25.45 | 0.3968 | 714.0 | 580.9 | |
| Proj. U | - Projected umbra area in millionths of solar disc, negative values indicate | |
|
that the umbra consists of fragmented regions which cannot be separated without losing umbral area. In this way several spots (intensity minima in the umbra) have a common umbra, e.g. -2 means that the given spot shares an umbra with spot No.2, and the common U value is indicated at spot No.2. |
||
| Proj. WS | - Projected whole spot area in millionths of solar disc, negative values indicate | |
|
that several umbras have a common penumbra, e.g. -7 means that the given umbra shares a penumbra with umbra No.7, and the WS value is indicated at No.7. |
||
| Corr. U | - Corrected umbra area in millionths of solar hemisphere, for negative values see above | |
| Corr. WS | - Corrected whole spot area in millionths of solar hemisphere, for negative values see above | |
| B | - Heliographic latitude B; positive: North, negative: South | |
| L | - Heliographic longitude L | |
| LCM | - Longitudinal distance from the Sun's central meridian | |
| Pos. angle | - Position angle | |
| r | - Distance from the centre of Sun's disc in terms of Sun's radius | |
| MU | - Mean magnetic field within the umbra contour averaged the pixel values with sign. | |
| MP | - Mean magnetic field within the penumbra contour averaged the pixel values with sign. | |