SDO HMI 2014-09-11 04:00:36 UT
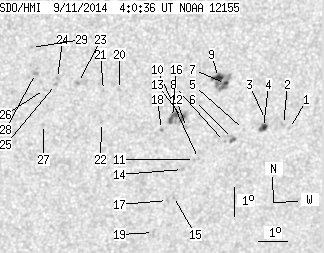
See sunspots with tool (Click here to study sunspot positions and configurations with tool using white-light and magnetogram images and polarity drawing)
(It is recommended to set high resolution on your display!)
| group | Proj. U | Proj. WS | Corr. U | Corr. WS | B | L | LCM | Pos. angle | r | MU | MP |
| 16.39 | 80.82 | 9.85 | 48.38 | -19.90 | 107.38 | 20.85 | 216.64 | 0.5621 | 443.0 | 418.9 | |
|
previous
or next observation for the same group /
back to the solar disc SDO HMI 2014-09-11 04:00:36 UT
See sunspots with tool (Click here to study sunspot positions and configurations with tool using white-light and magnetogram images and polarity drawing) (It is recommended to set high resolution on your display!) |
| spot | Proj. U | Proj. WS | Corr. U | Corr. WS | B | L | LCM | Pos. angle | r | MU | MP |
| 0.00 | 1.16 | 0.00 | 0.72 | -20.61 | 111.07 | 24.55 | 220.41 | 0.6020 | 551.0 | 388.8 | |
| 0.00 | 1.96 | 0.00 | 1.21 | -20.46 | 110.83 | 24.31 | 220.31 | 0.5984 | 643.0 | 525.7 | |
| 0.00 | 0.98 | 0.00 | 0.60 | -20.25 | 110.16 | 23.64 | 219.78 | 0.5902 | 652.0 | 481.9 | |
| 3.47 | 5.52 | 2.13 | 3.39 | -20.53 | 110.14 | 23.61 | 219.44 | 0.5928 | 773.7 | 578.6 | |
| 0.00 | 1.07 | 0.00 | 0.65 | -20.56 | 109.44 | 22.92 | 218.57 | 0.5870 | 545.0 | 466.5 | |
| 0.00 | 4.01 | 0.00 | 2.45 | -20.84 | 109.10 | 22.58 | 217.84 | 0.5871 | 677.0 | 611.2 | |
| 1.51 | 23.25 | 0.91 | 13.88 | -18.95 | 108.58 | 22.05 | 219.36 | 0.5620 | 771.9 | 617.0 | |
| 0.00 | 1.07 | 0.00 | 0.65 | -20.93 | 108.83 | 22.31 | 217.42 | 0.5858 | 615.0 | 547.5 | |
| 5.44 | -7.00 | 3.24 | -7.00 | -18.74 | 108.31 | 21.78 | 219.28 | 0.5572 | 1017.4 | 999999 | |
| 0.00 | 0.89 | 0.00 | 0.54 | -21.47 | 108.01 | 21.49 | 215.81 | 0.5847 | 551.0 | 515.2 | |
| 0.00 | 1.25 | 0.00 | 0.76 | -21.50 | 107.87 | 21.35 | 215.61 | 0.5839 | 615.0 | 561.4 | |
| 0.00 | 1.78 | 0.00 | 1.07 | -20.38 | 107.43 | 20.91 | 216.26 | 0.5678 | 632.0 | 486.2 | |
| 2.05 | 15.68 | 1.23 | 9.37 | -20.03 | 107.25 | 20.72 | 216.41 | 0.5622 | 900.5 | 740.7 | |
| 0.00 | 1.87 | 0.00 | 1.14 | -21.82 | 107.51 | 20.98 | 214.80 | 0.5846 | 711.0 | 558.6 | |
| 0.00 | 1.34 | 0.00 | 0.82 | -22.75 | 107.34 | 20.81 | 213.64 | 0.5937 | 621.0 | 507.4 | |
| 3.92 | -13.00 | 2.34 | -13.00 | -20.02 | 106.90 | 20.38 | 215.97 | 0.5591 | 960.1 | 999999 | |
| 0.00 | 1.34 | 0.00 | 0.82 | -22.88 | 107.15 | 20.62 | 213.27 | 0.5937 | 669.0 | 537.0 | |
| 0.00 | 1.16 | 0.00 | 0.69 | -20.41 | 106.58 | 20.05 | 215.11 | 0.5609 | 689.0 | 662.2 | |
| 0.00 | 2.41 | 0.00 | 1.49 | -23.99 | 106.83 | 20.31 | 211.80 | 0.6040 | 812.0 | 633.5 | |
| 0.00 | 1.43 | 0.00 | 0.83 | -18.98 | 104.97 | 18.45 | 214.46 | 0.5308 | 705.0 | 518.7 | |
| 0.00 | 0.98 | 0.00 | 0.57 | -18.99 | 104.43 | 17.91 | 213.67 | 0.5265 | 755.0 | 608.0 | |
| 0.00 | 0.98 | 0.00 | 0.58 | -20.08 | 104.49 | 17.97 | 212.58 | 0.5401 | 667.0 | 574.1 | |
| 0.00 | 2.41 | 0.00 | 1.39 | -18.69 | 103.56 | 17.04 | 212.71 | 0.5157 | -735.0 | -453.1 | |
| 0.00 | 1.51 | 0.00 | 0.87 | -18.53 | 102.85 | 16.33 | 211.79 | 0.5080 | -767.0 | -595.6 | |
| 0.00 | 1.43 | 0.00 | 0.82 | -18.73 | 102.80 | 16.28 | 211.50 | 0.5101 | -695.0 | -580.2 | |
| 0.00 | 1.60 | 0.00 | 0.92 | -18.88 | 102.45 | 15.93 | 210.79 | 0.5094 | -592.0 | -498.1 | |
| 0.00 | 1.07 | 0.00 | 0.62 | -20.07 | 102.54 | 16.01 | 209.70 | 0.5251 | -554.0 | -417.1 | |
| 0.00 | 1.69 | 0.00 | 0.97 | -18.33 | 102.10 | 15.58 | 210.81 | 0.4997 | -915.0 | -789.3 | |
| 0.00 | 0.98 | 0.00 | 0.56 | -17.46 | 101.89 | 15.37 | 211.43 | 0.4868 | -857.0 | -679.6 | |
| Proj. U | - Projected umbra area in millionths of solar disc, negative values indicate | |
|
that the umbra consists of fragmented regions which cannot be separated without losing umbral area. In this way several spots (intensity minima in the umbra) have a common umbra, e.g. -2 means that the given spot shares an umbra with spot No.2, and the common U value is indicated at spot No.2. |
||
| Proj. WS | - Projected whole spot area in millionths of solar disc, negative values indicate | |
|
that several umbras have a common penumbra, e.g. -7 means that the given umbra shares a penumbra with umbra No.7, and the WS value is indicated at No.7. |
||
| Corr. U | - Corrected umbra area in millionths of solar hemisphere, for negative values see above | |
| Corr. WS | - Corrected whole spot area in millionths of solar hemisphere, for negative values see above | |
| B | - Heliographic latitude B; positive: North, negative: South | |
| L | - Heliographic longitude L | |
| LCM | - Longitudinal distance from the Sun's central meridian | |
| Pos. angle | - Position angle | |
| r | - Distance from the centre of Sun's disc in terms of Sun's radius | |
| MU | - Mean magnetic field within the umbra contour averaged the pixel values with sign. | |
| MP | - Mean magnetic field within the penumbra contour averaged the pixel values with sign. | |