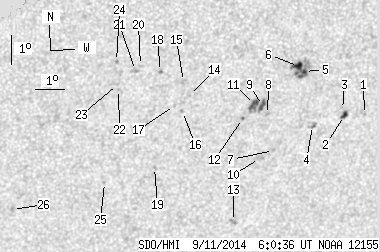
SDO HMI 2014-09-11 06:00:36 UT
See sunspots with tool (Click here to study sunspot positions and configurations with tool using white-light and magnetogram images and polarity drawing)
(It is recommended to set high resolution on your display!)
| group | Proj. U | Proj. WS | Corr. U | Corr. WS | B | L | LCM | Pos. angle | r | MU | MP |
| 15.50 | 80.03 | 9.38 | 48.13 | -19.95 | 106.87 | 21.44 | 217.35 | 0.5681 | 355.6 | 347.1 | |
|
previous
or next observation for the same group /
back to the solar disc SDO HMI 2014-09-11 06:00:36 UT
See sunspots with tool (Click here to study sunspot positions and configurations with tool using white-light and magnetogram images and polarity drawing) (It is recommended to set high resolution on your display!) |
| spot | Proj. U | Proj. WS | Corr. U | Corr. WS | B | L | LCM | Pos. angle | r | MU | MP |
| 0.00 | 1.07 | 0.00 | 0.67 | -20.54 | 110.93 | 25.50 | 221.56 | 0.6098 | 676.0 | 550.3 | |
| 2.41 | 4.01 | 1.49 | 2.49 | -20.53 | 110.21 | 24.78 | 220.78 | 0.6033 | 767.9 | 620.7 | |
| 0.00 | 1.34 | 0.00 | 0.83 | -20.32 | 110.10 | 24.68 | 220.90 | 0.6002 | 331.0 | 470.7 | |
| 0.00 | 3.39 | 0.00 | 2.09 | -20.81 | 109.13 | 23.70 | 219.22 | 0.5964 | 641.0 | 565.9 | |
| 1.60 | 24.42 | 0.97 | 14.69 | -18.95 | 108.55 | 23.13 | 220.70 | 0.5718 | 780.3 | 557.1 | |
| 4.72 | -5.00 | 2.84 | -5.00 | -18.77 | 108.32 | 22.89 | 220.63 | 0.5677 | 1070.1 | 999999 | |
| 0.00 | 1.34 | 0.00 | 0.82 | -21.60 | 107.88 | 22.45 | 216.87 | 0.5941 | 671.0 | 538.6 | |
| 0.00 | 1.69 | 0.00 | 1.02 | -20.34 | 107.48 | 22.05 | 217.75 | 0.5770 | 583.0 | 516.4 | |
| 2.85 | 14.52 | 1.72 | 8.74 | -20.03 | 107.25 | 21.83 | 217.84 | 0.5716 | 853.8 | 728.9 | |
| 0.00 | 3.74 | 0.00 | 2.30 | -21.85 | 107.43 | 22.00 | 216.05 | 0.5931 | 105.0 | 242.8 | |
| 3.92 | -9.00 | 2.36 | -9.00 | -19.98 | 106.97 | 21.54 | 217.53 | 0.5686 | 978.2 | 999999 | |
| 0.00 | 1.07 | 0.00 | 0.64 | -20.44 | 106.62 | 21.19 | 216.57 | 0.5707 | 791.0 | 735.2 | |
| 0.00 | 3.30 | 0.00 | 2.06 | -24.01 | 106.88 | 21.45 | 213.17 | 0.6127 | 758.0 | 634.3 | |
| 0.00 | 1.07 | 0.00 | 0.63 | -19.56 | 104.69 | 19.26 | 214.97 | 0.5444 | 524.0 | 493.5 | |
| 0.00 | 2.94 | 0.00 | 1.72 | -19.08 | 104.43 | 19.00 | 215.15 | 0.5365 | 566.0 | 450.7 | |
| 0.00 | 1.34 | 0.00 | 0.79 | -20.10 | 104.52 | 19.09 | 214.15 | 0.5493 | 666.0 | 570.7 | |
| 0.00 | 0.98 | 0.00 | 0.58 | -19.88 | 104.22 | 18.79 | 213.97 | 0.5443 | 657.0 | 467.8 | |
| 0.00 | 1.43 | 0.00 | 0.83 | -18.71 | 103.61 | 18.18 | 214.39 | 0.5252 | -751.0 | -641.2 | |
| 0.00 | 1.43 | 0.00 | 0.86 | -21.98 | 103.81 | 18.38 | 211.22 | 0.5662 | 738.0 | 551.1 | |
| 0.00 | 1.69 | 0.00 | 0.98 | -18.48 | 102.91 | 17.49 | 213.63 | 0.5167 | -615.0 | -518.3 | |
| 0.00 | 3.56 | 0.00 | 2.06 | -18.64 | 102.76 | 17.34 | 213.22 | 0.5174 | -599.0 | -523.4 | |
| 0.00 | 1.07 | 0.00 | 0.62 | -19.26 | 102.26 | 16.83 | 211.79 | 0.5211 | -631.0 | -476.5 | |
| 0.00 | 1.07 | 0.00 | 0.62 | -19.09 | 102.21 | 16.78 | 211.89 | 0.5185 | -834.0 | -685.3 | |
| 0.00 | 1.07 | 0.00 | 0.61 | -18.31 | 102.10 | 16.67 | 212.57 | 0.5080 | -863.0 | -793.6 | |
| 0.00 | 0.98 | 0.00 | 0.58 | -22.43 | 102.15 | 16.72 | 208.48 | 0.5599 | -630.0 | -548.5 | |
| 0.00 | 1.51 | 0.00 | 0.90 | -23.26 | 99.12 | 13.69 | 203.32 | 0.5514 | -698.0 | -571.1 | |
| Proj. U | - Projected umbra area in millionths of solar disc, negative values indicate | |
|
that the umbra consists of fragmented regions which cannot be separated without losing umbral area. In this way several spots (intensity minima in the umbra) have a common umbra, e.g. -2 means that the given spot shares an umbra with spot No.2, and the common U value is indicated at spot No.2. |
||
| Proj. WS | - Projected whole spot area in millionths of solar disc, negative values indicate | |
|
that several umbras have a common penumbra, e.g. -7 means that the given umbra shares a penumbra with umbra No.7, and the WS value is indicated at No.7. |
||
| Corr. U | - Corrected umbra area in millionths of solar hemisphere, for negative values see above | |
| Corr. WS | - Corrected whole spot area in millionths of solar hemisphere, for negative values see above | |
| B | - Heliographic latitude B; positive: North, negative: South | |
| L | - Heliographic longitude L | |
| LCM | - Longitudinal distance from the Sun's central meridian | |
| Pos. angle | - Position angle | |
| r | - Distance from the centre of Sun's disc in terms of Sun's radius | |
| MU | - Mean magnetic field within the umbra contour averaged the pixel values with sign. | |
| MP | - Mean magnetic field within the penumbra contour averaged the pixel values with sign. | |