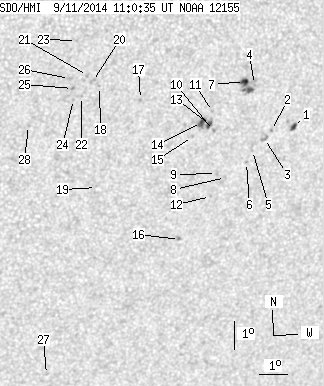
SDO HMI 2014-09-11 11:00:35 UT
See sunspots with tool (Click here to study sunspot positions and configurations with tool using white-light and magnetogram images and polarity drawing)
(It is recommended to set high resolution on your display!)
| group | Proj. U | Proj. WS | Corr. U | Corr. WS | B | L | LCM | Pos. angle | r | MU | MP |
| 10.25 | 59.69 | 6.33 | 36.66 | -19.84 | 106.91 | 24.23 | 220.86 | 0.5913 | 262.0 | 327.7 | |
|
previous
or next observation for the same group /
back to the solar disc SDO HMI 2014-09-11 11:00:35 UT
See sunspots with tool (Click here to study sunspot positions and configurations with tool using white-light and magnetogram images and polarity drawing) (It is recommended to set high resolution on your display!) |
| spot | Proj. U | Proj. WS | Corr. U | Corr. WS | B | L | LCM | Pos. angle | r | MU | MP |
| 1.96 | 3.56 | 1.24 | 2.26 | -20.39 | 110.32 | 27.63 | 224.00 | 0.6281 | 715.2 | 552.2 | |
| 0.00 | 1.16 | 0.00 | 0.73 | -20.45 | 109.53 | 26.84 | 223.12 | 0.6212 | 771.0 | 592.8 | |
| 0.00 | 3.56 | 0.00 | 2.25 | -20.71 | 109.33 | 26.64 | 222.61 | 0.6218 | 539.0 | 565.4 | |
| 0.00 | 0.80 | 0.00 | 0.49 | -18.84 | 108.64 | 25.95 | 224.09 | 0.5974 | 214.0 | 178.1 | |
| 0.00 | 0.62 | 0.00 | 0.39 | -21.09 | 108.97 | 26.28 | 221.78 | 0.6222 | 547.0 | 490.9 | |
| 0.00 | 0.98 | 0.00 | 0.62 | -21.50 | 108.83 | 26.14 | 221.18 | 0.6249 | 472.0 | 358.2 | |
| 3.21 | 15.77 | 1.97 | 9.70 | -18.72 | 108.26 | 25.58 | 223.83 | 0.5926 | 1002.3 | 632.0 | |
| 0.00 | 1.34 | 0.00 | 0.84 | -21.97 | 108.16 | 25.47 | 219.93 | 0.6237 | 554.0 | 443.4 | |
| 0.00 | 1.43 | 0.00 | 0.90 | -21.81 | 107.81 | 25.12 | 219.72 | 0.6190 | 602.0 | 589.8 | |
| 0.00 | 1.60 | 0.00 | 0.99 | -20.32 | 107.43 | 24.74 | 220.99 | 0.6007 | 681.0 | 548.5 | |
| 0.00 | 0.89 | 0.00 | 0.55 | -19.67 | 107.29 | 24.60 | 221.59 | 0.5928 | 720.0 | 547.1 | |
| 0.00 | 0.98 | 0.00 | 0.62 | -22.60 | 107.74 | 25.05 | 218.78 | 0.6264 | 639.0 | 527.8 | |
| 2.05 | 10.69 | 1.26 | 6.58 | -20.11 | 107.26 | 24.57 | 221.04 | 0.5969 | 857.0 | 721.4 | |
| 3.03 | -13.00 | 1.86 | -13.00 | -20.02 | 106.96 | 24.27 | 220.79 | 0.5933 | 925.4 | 999999 | |
| 0.00 | 1.07 | 0.00 | 0.66 | -20.48 | 106.72 | 24.03 | 219.98 | 0.5958 | 788.0 | 628.3 | |
| 0.00 | 1.16 | 0.00 | 0.74 | -24.06 | 106.91 | 24.22 | 216.34 | 0.6344 | 783.0 | 732.1 | |
| 0.00 | 1.25 | 0.00 | 0.75 | -19.12 | 104.69 | 22.01 | 219.12 | 0.5632 | 756.0 | 656.1 | |
| 0.00 | 0.89 | 0.00 | 0.53 | -18.62 | 103.22 | 20.53 | 217.81 | 0.5443 | -596.0 | -427.7 | |
| 0.00 | 0.62 | 0.00 | 0.38 | -22.07 | 103.60 | 20.91 | 214.48 | 0.5865 | 469.0 | 473.6 | |
| 0.00 | 2.67 | 0.00 | 1.57 | -18.44 | 102.96 | 20.27 | 217.67 | 0.5400 | -700.0 | -496.1 | |
| 0.00 | 1.25 | 0.00 | 0.73 | -18.23 | 102.77 | 20.08 | 217.66 | 0.5358 | -440.0 | -400.1 | |
| 0.00 | 0.80 | 0.00 | 0.47 | -18.92 | 102.65 | 19.96 | 216.67 | 0.5428 | -596.0 | -473.3 | |
| 0.00 | 0.36 | 0.00 | 0.21 | -17.04 | 102.26 | 19.57 | 218.40 | 0.5177 | -646.0 | -743.8 | |
| 0.00 | 0.71 | 0.00 | 0.42 | -19.01 | 102.39 | 19.70 | 216.21 | 0.5415 | -681.0 | -597.0 | |
| 0.00 | 1.43 | 0.00 | 0.84 | -18.64 | 102.31 | 19.62 | 216.54 | 0.5365 | -817.0 | -707.1 | |
| 0.00 | 2.14 | 0.00 | 1.25 | -18.30 | 102.17 | 19.48 | 216.74 | 0.5313 | -768.0 | -659.9 | |
| 0.00 | 0.62 | 0.00 | 0.41 | -28.73 | 103.00 | 20.31 | 207.68 | 0.6576 | -532.0 | -510.0 | |
| 0.00 | 1.34 | 0.00 | 0.78 | -19.82 | 100.96 | 18.27 | 213.31 | 0.5392 | -474.0 | -465.6 | |
| Proj. U | - Projected umbra area in millionths of solar disc, negative values indicate | |
|
that the umbra consists of fragmented regions which cannot be separated without losing umbral area. In this way several spots (intensity minima in the umbra) have a common umbra, e.g. -2 means that the given spot shares an umbra with spot No.2, and the common U value is indicated at spot No.2. |
||
| Proj. WS | - Projected whole spot area in millionths of solar disc, negative values indicate | |
|
that several umbras have a common penumbra, e.g. -7 means that the given umbra shares a penumbra with umbra No.7, and the WS value is indicated at No.7. |
||
| Corr. U | - Corrected umbra area in millionths of solar hemisphere, for negative values see above | |
| Corr. WS | - Corrected whole spot area in millionths of solar hemisphere, for negative values see above | |
| B | - Heliographic latitude B; positive: North, negative: South | |
| L | - Heliographic longitude L | |
| LCM | - Longitudinal distance from the Sun's central meridian | |
| Pos. angle | - Position angle | |
| r | - Distance from the centre of Sun's disc in terms of Sun's radius | |
| MU | - Mean magnetic field within the umbra contour averaged the pixel values with sign. | |
| MP | - Mean magnetic field within the penumbra contour averaged the pixel values with sign. | |