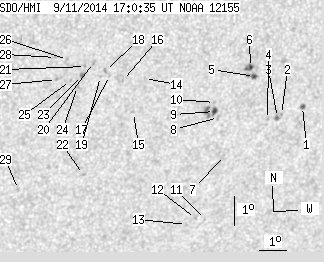
SDO HMI 2014-09-11 17:00:35 UT
See sunspots with tool (Click here to study sunspot positions and configurations with tool using white-light and magnetogram images and polarity drawing)
(It is recommended to set high resolution on your display!)
| group | Proj. U | Proj. WS | Corr. U | Corr. WS | B | L | LCM | Pos. angle | r | MU | MP |
| 6.77 | 52.60 | 4.33 | 33.02 | -19.82 | 106.18 | 26.80 | 223.67 | 0.6152 | 43.8 | 194.9 | |
|
previous
or next observation for the same group /
back to the solar disc SDO HMI 2014-09-11 17:00:35 UT
See sunspots with tool (Click here to study sunspot positions and configurations with tool using white-light and magnetogram images and polarity drawing) (It is recommended to set high resolution on your display!) |
| spot | Proj. U | Proj. WS | Corr. U | Corr. WS | B | L | LCM | Pos. angle | r | MU | MP |
| 1.25 | 2.58 | 0.82 | 1.70 | -20.19 | 110.51 | 31.12 | 227.56 | 0.6596 | 739.9 | 563.5 | |
| 0.00 | 0.98 | 0.00 | 0.64 | -20.41 | 109.77 | 30.38 | 226.64 | 0.6543 | 632.0 | 550.9 | |
| 0.71 | 2.14 | 0.46 | 1.40 | -20.50 | 109.64 | 30.25 | 226.41 | 0.6539 | 740.0 | 565.2 | |
| 0.00 | 1.16 | 0.00 | 0.75 | -20.54 | 109.27 | 29.89 | 226.02 | 0.6508 | 613.0 | 592.5 | |
| 1.60 | 5.78 | 1.02 | 3.68 | -19.04 | 108.49 | 29.10 | 227.07 | 0.6302 | 707.8 | 637.0 | |
| 1.25 | 5.25 | 0.79 | 3.33 | -18.73 | 108.28 | 28.90 | 227.26 | 0.6254 | 921.2 | 723.7 | |
| 0.00 | 0.80 | 0.00 | 0.52 | -21.68 | 107.92 | 28.54 | 223.41 | 0.6483 | 666.0 | 449.7 | |
| 0.00 | 1.78 | 0.00 | 1.13 | -20.35 | 107.43 | 28.04 | 224.46 | 0.6316 | 569.0 | 450.4 | |
| 1.96 | 8.81 | 1.24 | 5.59 | -20.14 | 107.24 | 27.86 | 224.52 | 0.6279 | 815.9 | 734.5 | |
| 0.00 | 1.16 | 0.00 | 0.73 | -19.83 | 107.18 | 27.80 | 224.83 | 0.6245 | 671.0 | 504.5 | |
| 0.00 | 0.80 | 0.00 | 0.53 | -23.88 | 107.72 | 28.33 | 220.78 | 0.6666 | 526.0 | 442.7 | |
| 0.00 | 1.07 | 0.00 | 0.70 | -23.82 | 107.33 | 27.94 | 220.47 | 0.6628 | 720.0 | 550.2 | |
| 0.00 | 0.98 | 0.00 | 0.65 | -24.02 | 107.04 | 27.65 | 219.98 | 0.6621 | 686.0 | 621.4 | |
| 0.00 | 0.98 | 0.00 | 0.60 | -18.86 | 104.51 | 25.12 | 223.15 | 0.5897 | 680.0 | 567.8 | |
| 0.00 | 0.80 | 0.00 | 0.49 | -19.99 | 104.30 | 24.92 | 221.57 | 0.5990 | 652.0 | 520.2 | |
| 0.00 | 0.80 | 0.00 | 0.49 | -18.88 | 103.74 | 24.35 | 222.25 | 0.5825 | -617.0 | -488.1 | |
| 0.00 | 0.71 | 0.00 | 0.43 | -18.69 | 103.25 | 23.87 | 221.92 | 0.5760 | -565.0 | -489.8 | |
| 0.00 | 1.60 | 0.00 | 0.97 | -18.51 | 103.09 | 23.70 | 221.94 | 0.5726 | -725.0 | -546.9 | |
| 0.00 | 0.98 | 0.00 | 0.59 | -18.70 | 102.94 | 23.56 | 221.53 | 0.5732 | -447.0 | -378.5 | |
| 0.00 | 2.14 | 0.00 | 1.28 | -18.22 | 102.63 | 23.25 | 221.75 | 0.5652 | -563.0 | -422.6 | |
| 0.00 | 0.71 | 0.00 | 0.43 | -18.34 | 102.37 | 22.99 | 221.28 | 0.5640 | -775.0 | -609.9 | |
| 0.00 | 1.33 | 0.00 | 0.83 | -22.03 | 102.88 | 23.50 | 217.65 | 0.6074 | -524.0 | -445.6 | |
| 0.00 | 1.87 | 0.00 | 1.12 | -18.64 | 102.31 | 22.92 | 220.85 | 0.5665 | -832.0 | -805.2 | |
| 0.00 | 1.42 | 0.00 | 0.86 | -19.00 | 102.19 | 22.80 | 220.26 | 0.5692 | -719.0 | -642.1 | |
| 0.00 | 0.98 | 0.00 | 0.59 | -18.78 | 101.91 | 22.53 | 220.18 | 0.5644 | -758.0 | -660.3 | |
| 0.00 | 1.07 | 0.00 | 0.63 | -18.07 | 101.71 | 22.33 | 220.80 | 0.5549 | -838.0 | -639.9 | |
| 0.00 | 1.25 | 0.00 | 0.74 | -18.72 | 101.42 | 22.04 | 219.64 | 0.5592 | -720.0 | -616.2 | |
| 0.00 | 0.89 | 0.00 | 0.53 | -17.98 | 101.29 | 21.91 | 220.37 | 0.5500 | -708.0 | -571.4 | |
| 0.00 | 1.78 | 0.00 | 1.09 | -22.43 | 100.65 | 21.27 | 214.55 | 0.5935 | -489.0 | -282.0 | |
| Proj. U | - Projected umbra area in millionths of solar disc, negative values indicate | |
|
that the umbra consists of fragmented regions which cannot be separated without losing umbral area. In this way several spots (intensity minima in the umbra) have a common umbra, e.g. -2 means that the given spot shares an umbra with spot No.2, and the common U value is indicated at spot No.2. |
||
| Proj. WS | - Projected whole spot area in millionths of solar disc, negative values indicate | |
|
that several umbras have a common penumbra, e.g. -7 means that the given umbra shares a penumbra with umbra No.7, and the WS value is indicated at No.7. |
||
| Corr. U | - Corrected umbra area in millionths of solar hemisphere, for negative values see above | |
| Corr. WS | - Corrected whole spot area in millionths of solar hemisphere, for negative values see above | |
| B | - Heliographic latitude B; positive: North, negative: South | |
| L | - Heliographic longitude L | |
| LCM | - Longitudinal distance from the Sun's central meridian | |
| Pos. angle | - Position angle | |
| r | - Distance from the centre of Sun's disc in terms of Sun's radius | |
| MU | - Mean magnetic field within the umbra contour averaged the pixel values with sign. | |
| MP | - Mean magnetic field within the penumbra contour averaged the pixel values with sign. | |